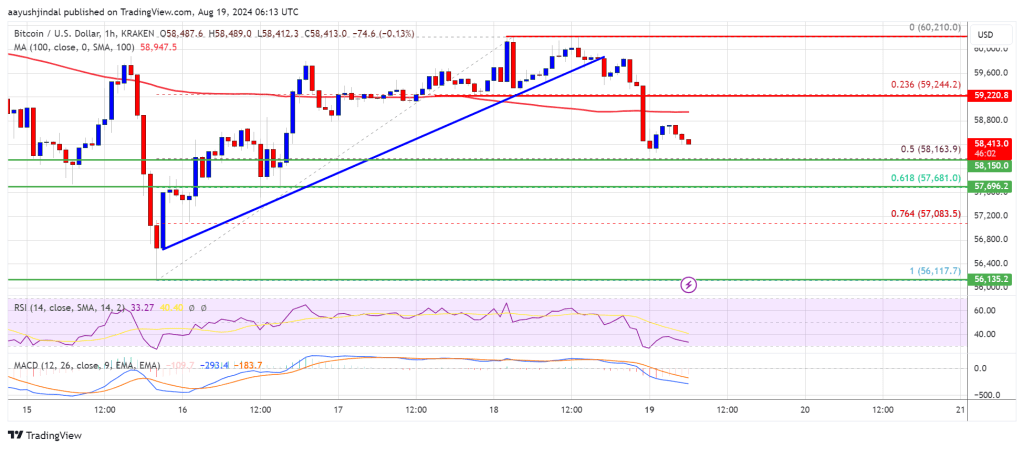
Bitcoin price started a fresh decline from the $60,000 resistance zone. BTC is now moving lower and might test the $57,650 support zone.
Bitcoin started a fresh decline from the $60,000 resistance zone.
The price is trading below $58,800 and the 100 hourly Simple moving average.
There was a break below a key bullish trend line with support at $59,700 on the hourly chart of the BTC/USD pair (data feed from Kraken).
The pair might attempt a fresh increase if it stays above the $57,650 zone.
Bitcoin price struggled to settle above the $60,000 resistance zone. BTC formed a top near the $60,200 level before the price started a fresh decline. There was a move below the $58,500 support zone.
The price declined below the 23.6% Fib retracement level of the upward move from the $56,117 swing low to the $60,210 high. Besides, there was a break below a key bullish trend line with support at $59,700 on the hourly chart of the BTC/USD pair.
The pair retested the $58,000 support zone. Bitcoin price is now trading below $59,000 and the 100 hourly Simple moving average. However, the price is still above the 50% Fib retracement level of the upward move from the $56,117 swing low to the $60,210 high.
On the upside, the price could face resistance near the $58,800 level. The first key resistance is near the $59,500 level. A clear move above the $59,500 resistance might send the price further higher in the coming sessions. The next key resistance could be $60,000.
A close above the $60,000 resistance might spark more upsides. In the stated case, the price could rise and test the $61,500 resistance.
If Bitcoin fails to rise above the $58,800 resistance zone, it could continue to move down. Immediate support on the downside is near the $58,000 level.
The first major support is $57,650. The next support is now near the $57,000 zone. Any more losses might send the price toward the $55,500 support zone or even $55,000 in the near term.
Technical indicators:
Hourly MACD – The MACD is now gaining pace in the bearish zone.
Hourly RSI (Relative Strength Index) – The RSI for BTC/USD is now below the 50 level.
Major Support Levels – $58,000, followed by $57,650.
Major Resistance Levels – $58,800, and $59,500.
[#item_full_content]NewsBTCRead MoreGlassnode data is showing buying across all cohorts of bitcoin holders.Read MoreCoinDesk: Bitcoin, Ethereum, Crypto…
The price of Bitcoin experienced one of the most bearish periods in its history over…
Crypto expert Tony Severino has opined that Bitcoin isn’t just showing signs of a yearly…
Arthur Hayes, co‑founder of BitMEX, has pointed to hedging tied to BlackRock’s iShares Bitcoin Trust…
Crypto sentiment was hit as Gemini plans to close operations in several regions and cut…
The selloff reflects bitcoin’s built-in volatility and market misreads of Fed policy, not structural weakness,…