Bitcoin price started a downside correction from the $62,700 resistance zone. BTC is now consolidating near $58,500 and struggling to recover.
Bitcoin started a decent downward move below the $61,500 and $60,000 levels.
The price is trading below $60,000 and the 100 hourly Simple moving average.
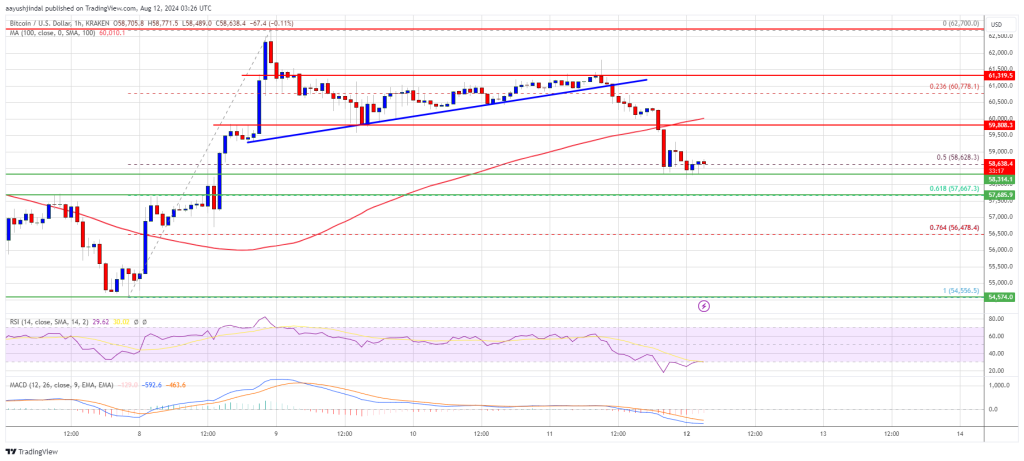
There was a break below a key bullish trend line with support at $61,000 on the hourly chart of the BTC/USD pair (data feed from Kraken).
The pair might decline further if it trades below the $58,500 support zone.
Bitcoin price started a downside correction after it failed to stay above $62,500. BTC declined below the $61,500 and $60,000 levels to move into a short-term bearish zone.
There was a break below a key bullish trend line with support at $61,000 on the hourly chart of the BTC/USD pair. The pair even dipped below the 50% Fib retracement level of the upward move from the $54,556 swing low to the $62,700 high.
Bitcoin price is now trading below $60,000 and the 100 hourly Simple moving average. The bulls are protecting the $58,500 support zone. The price is stable above the 61.8% Fib retracement level of the upward move from the $54,556 swing low to the $62,700 high.
On the upside, the price could face resistance near the $59,500 level. The first key resistance is near the $60,000 level. A clear move above the $60,000 resistance might send the price further higher in the coming sessions. The next key resistance could be $61,200.
The next major hurdle sits at $62,500. A close above the $62,500 resistance might spark bullish moves. In the stated case, the price could rise and test the $65,000 resistance.
If Bitcoin fails to rise above the $60,000 resistance zone, it could continue to move down. Immediate support on the downside is near the $58,500 level.
The first major support is $57,650. The next support is now near the $57,250 zone. Any more losses might send the price toward the $55,500 support zone or even $55,000 in the near term.
Technical indicators:
Hourly MACD – The MACD is now gaining pace in the bearish zone.
Hourly RSI (Relative Strength Index) – The RSI for BTC/USD is now below the 50 level.
Major Support Levels – $58,500, followed by $57,250.
Major Resistance Levels – $59,500, and $60,000.
[#item_full_content]NewsBTCRead MoreTL;DR: Deutsche Bank is preparing to introduce institutional digital asset custody services, initially targeting professional…
TL;DR: US spot Bitcoin ETFs recorded approximately $82.4 million in net outflows on October 16.…
TL;DR: MSCI has revised its methodology for classifying non-operating companies, putting Bitcoin-heavy treasury businesses under…
Google says its Willow chip can prepare the special quantum states needed for advanced calculations…
Bitcoin Magazine Poetic Justice: Scammer Lost $5M in Bitcoin After Being Targeted by Ledger Thieves…
Bitcoin Magazine BFFS26 Denver: Joseph Kelly on Bitcoin Custody and Credit; Alan Lane on Banking…