Bitcoin price started a fresh decline from the $108,800 zone. BTC is now consolidating and might aim for a move above the $106,500 resistance.
Bitcoin started a downside correction from the $108,800 zone.
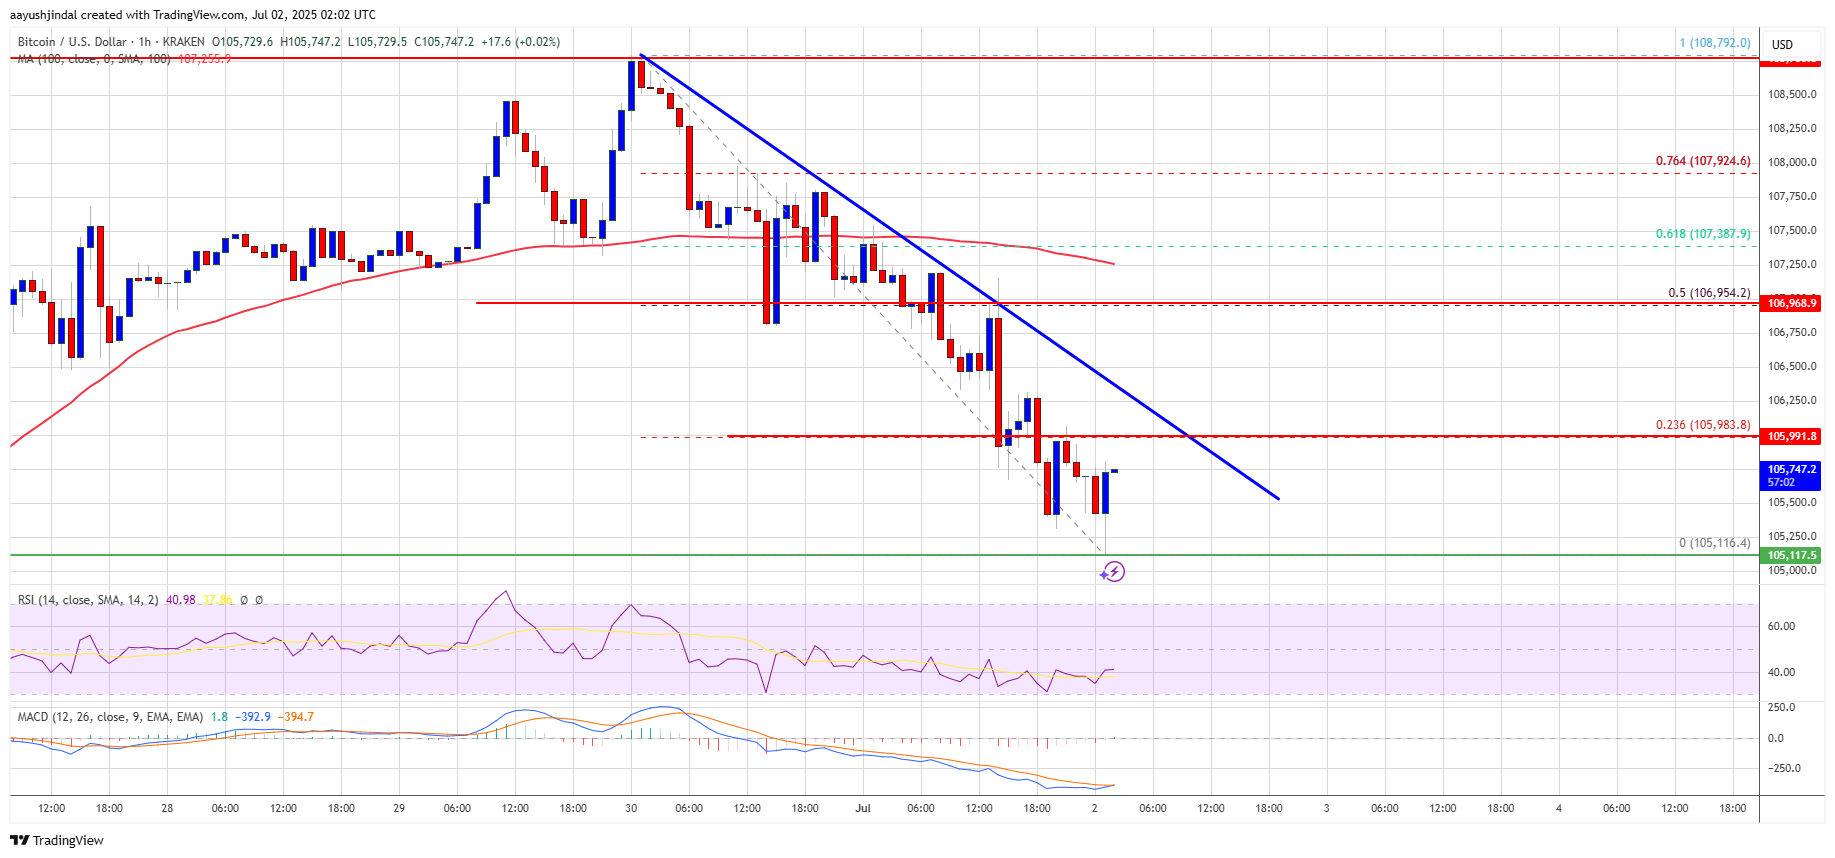
The price is trading below $107,000 and the 100 hourly Simple moving average.
There is a bearish trend line forming with resistance at $106,000 on the hourly chart of the BTC/USD pair (data feed from Kraken).
The pair could start a fresh increase if it stays above the $105,000 zone.
Bitcoin price failed to surpass the $108,800 resistance and started a fresh decline. BTC declined below the $107,000 level.
The bears even pushed the price below the $106,000 level. A low was formed at $105,116 and the price is now trading in a range below the 23.6% Fib retracement level of the downward move from the $108,792 swing high to the $105,116 low.
Bitcoin is now trading below $107,000 and the 100 hourly Simple moving average. On the upside, immediate resistance is near the $106,000 level. There is also a bearish trend line forming with resistance at $106,000 on the hourly chart of the BTC/USD pair.
The first key resistance is near the $106,500 level. A close above the $106,500 resistance might send the price further higher. In the stated case, the price could rise and test the $107,000 resistance level. It is close to the 50% Fib level of the downward move from the $108,792 swing high to the $105,116 low. Any more gains might send the price toward the $108,000 level.
If Bitcoin fails to rise above the $106,500 resistance zone, it could start another decline. Immediate support is near the $105,500 level. The first major support is near the $105,000 level.
The next support is now near the $104,200 zone. Any more losses might send the price toward the $103,500 support in the near term. The main support sits at $102,000, below which BTC might continue to move down.
Technical indicators:
Hourly MACD – The MACD is now losing pace in the bearish zone.
Hourly RSI (Relative Strength Index) – The RSI for BTC/USD is now below the 50 level.
Major Support Levels – $105,500, followed by $105,000.
Major Resistance Levels – $106,500 and $107,000.
[#item_full_content]NewsBTCRead MoreTL;DR Spot Bitcoin ETF products returned to net inflows after five straight days of outflows.…
A pattern stretching back to bitcoin's earliest days has held through every market cycle. It…
TL;DR GameStop’s Form 10-Q includes digital asset custody risk disclosures. The filing discusses circumstances in…
TL;DR Coinbase’s Quantum Advisory Council published a report on post-quantum migration and abandoned coins. The…
TL;DR Crypto Rover says Bitcoin has never bottomed below electrical production cost, currently estimated at…
TL;DR X trader Cup says Bitcoin may be in a quiet accumulation phase before a…