Bitcoin price started a fresh decline from the $108,800 zone. BTC is now consolidating and might aim for a move above the $106,500 resistance.
Bitcoin started a downside correction from the $108,800 zone.
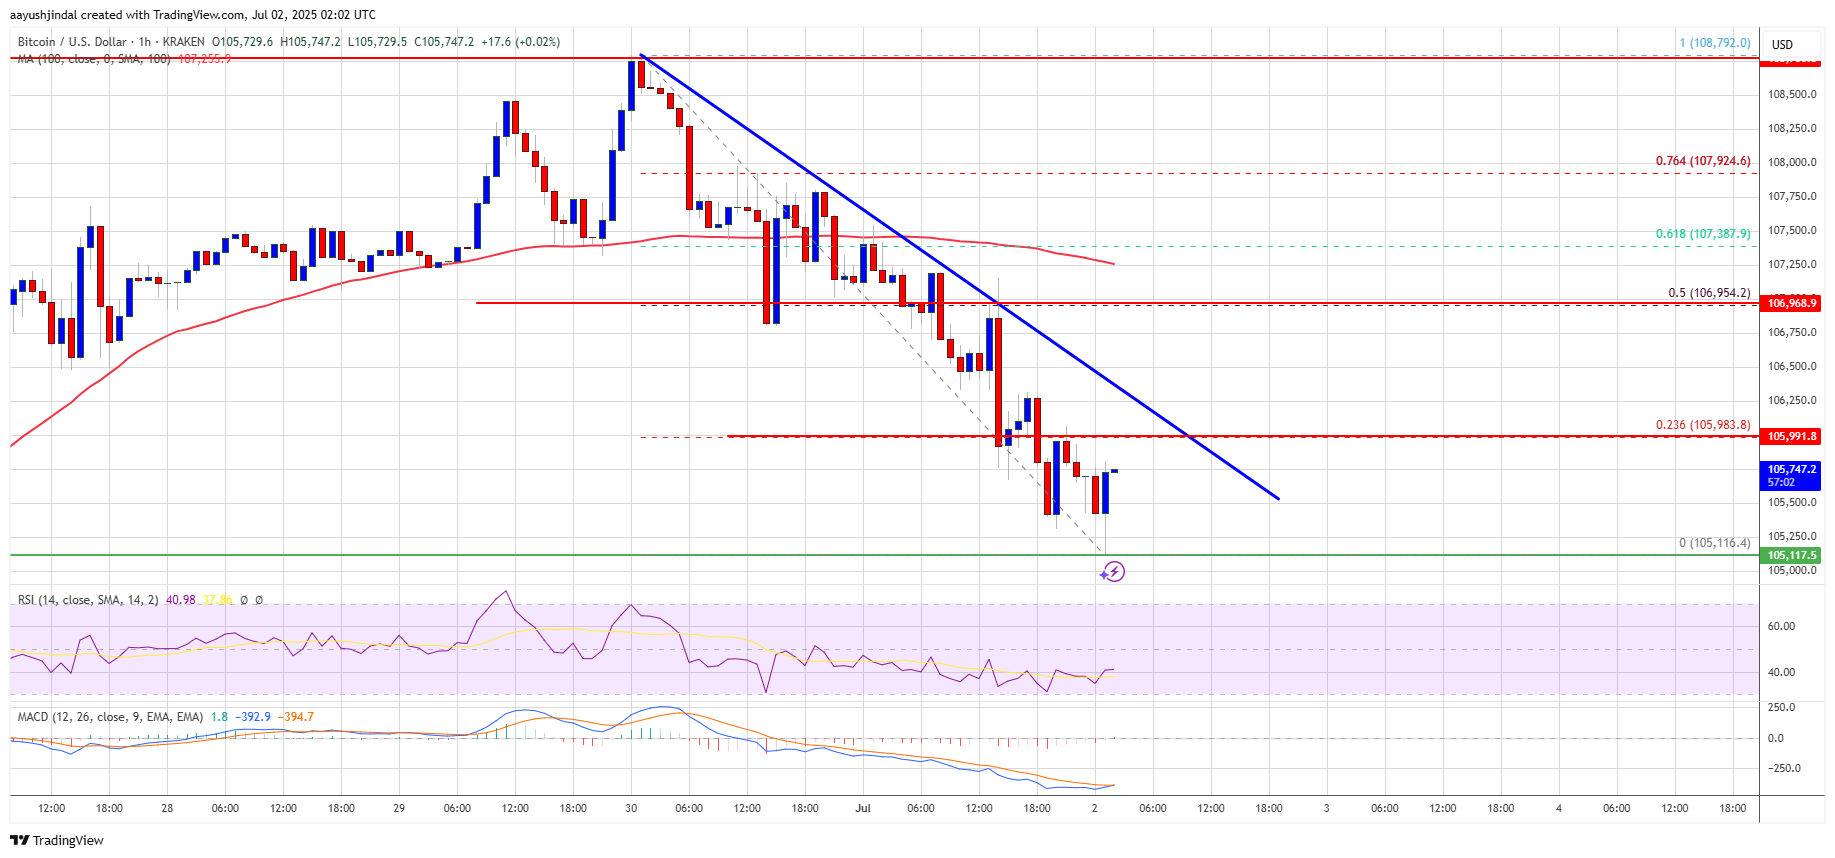
The price is trading below $107,000 and the 100 hourly Simple moving average.
There is a bearish trend line forming with resistance at $106,000 on the hourly chart of the BTC/USD pair (data feed from Kraken).
The pair could start a fresh increase if it stays above the $105,000 zone.
Bitcoin price failed to surpass the $108,800 resistance and started a fresh decline. BTC declined below the $107,000 level.
The bears even pushed the price below the $106,000 level. A low was formed at $105,116 and the price is now trading in a range below the 23.6% Fib retracement level of the downward move from the $108,792 swing high to the $105,116 low.
Bitcoin is now trading below $107,000 and the 100 hourly Simple moving average. On the upside, immediate resistance is near the $106,000 level. There is also a bearish trend line forming with resistance at $106,000 on the hourly chart of the BTC/USD pair.
The first key resistance is near the $106,500 level. A close above the $106,500 resistance might send the price further higher. In the stated case, the price could rise and test the $107,000 resistance level. It is close to the 50% Fib level of the downward move from the $108,792 swing high to the $105,116 low. Any more gains might send the price toward the $108,000 level.
If Bitcoin fails to rise above the $106,500 resistance zone, it could start another decline. Immediate support is near the $105,500 level. The first major support is near the $105,000 level.
The next support is now near the $104,200 zone. Any more losses might send the price toward the $103,500 support in the near term. The main support sits at $102,000, below which BTC might continue to move down.
Technical indicators:
Hourly MACD – The MACD is now losing pace in the bearish zone.
Hourly RSI (Relative Strength Index) – The RSI for BTC/USD is now below the 50 level.
Major Support Levels – $105,500, followed by $105,000.
Major Resistance Levels – $106,500 and $107,000.
[#item_full_content]NewsBTCRead MoreMcGlone links bitcoin’s downturn to record U.S. market cap-to-GDP levels, low equity volatility and rising…
The shift may be due to complex market dynamics, potentially reflecting the unwinding of a…
Bitcoin Magazine Harvard Trims Bitcoin Position by 21% in Q4 Portfolio Shift Harvard Management Company…
According to on-chain analyst Willy Woo, a long-running rise in Bitcoin’s value versus gold has…
Strategy says it can withstand a bitcoin price drop to $8,000 and still cover its…
Bitcoin is sitting at a “critical point,” with traders split between two familiar scripts: a…