Bitcoin price is attempting to recover above the $114,200 zone. BTC is now consolidating and might attempt to clear the $115,500 resistance zone.
Bitcoin started a recovery wave above the $113,500 zone.
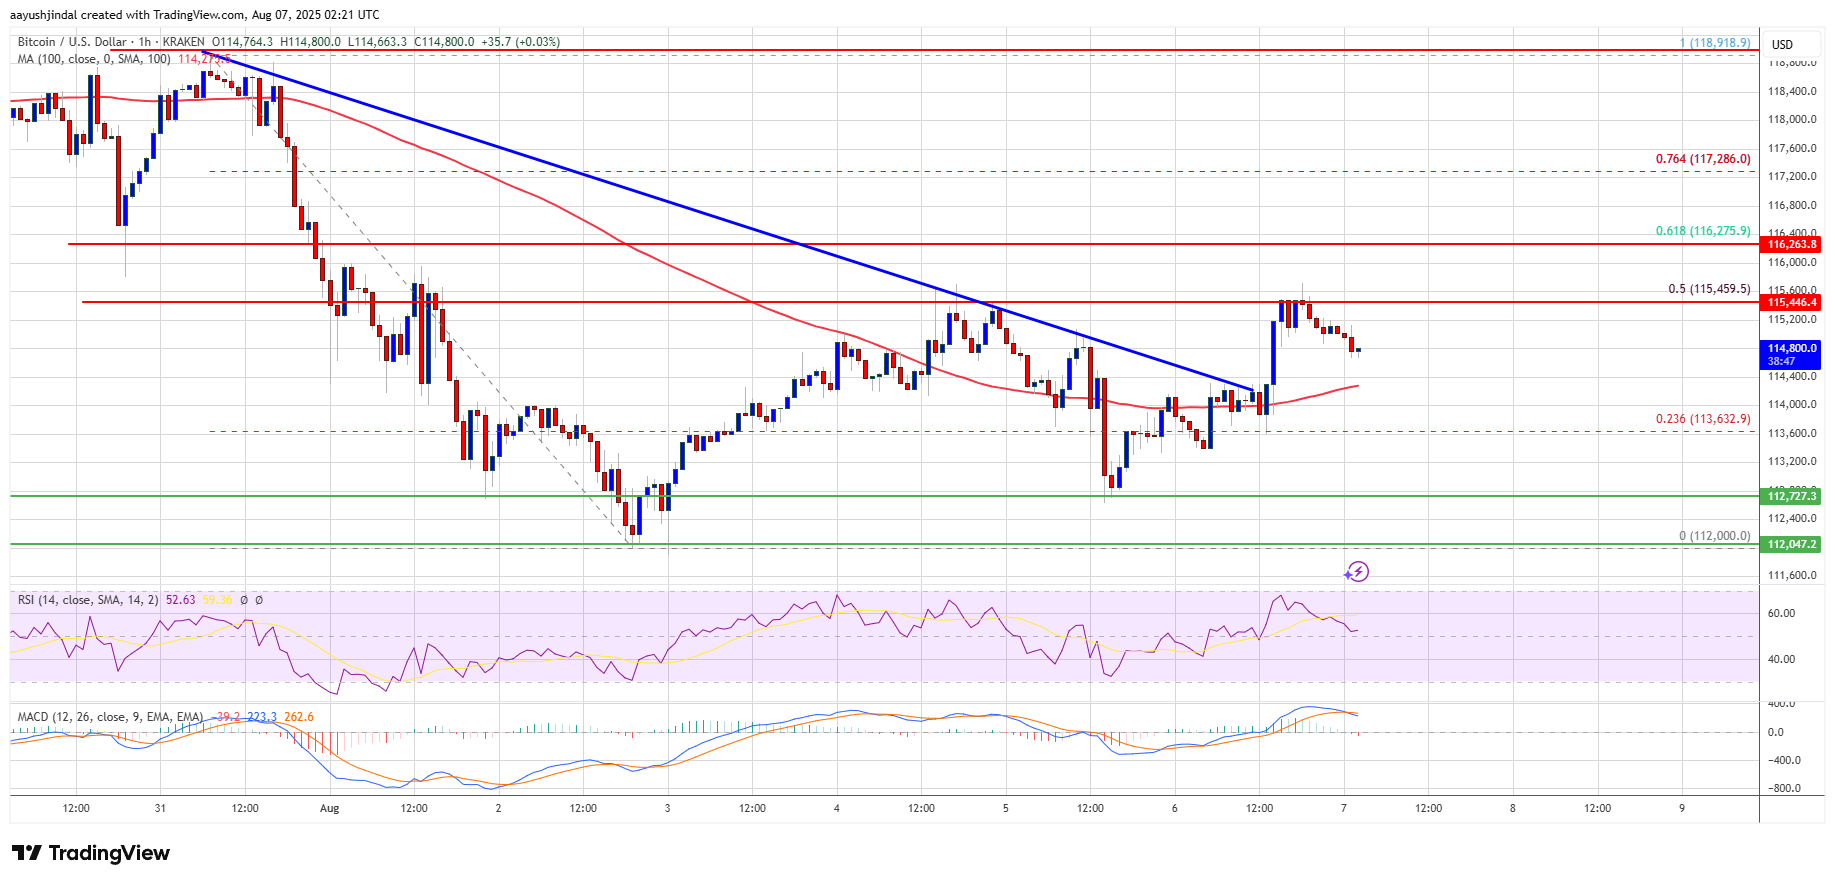
The price is trading above $114,000 and the 100 hourly Simple moving average.
There was a break above a bearish trend line with resistance at $114,300 on the hourly chart of the BTC/USD pair (data feed from Kraken).
The pair might start another increase if it clears the $115,500 resistance zone.
Bitcoin price found support near the $112,000 zone and started a recovery wave. BTC was able to climb above the $113,500 and $114,200 resistance levels.
Besides, there was a break above a bearish trend line with resistance at $114,300 on the hourly chart of the BTC/USD pair. The price climbed toward the 50% Fib retracement level of the move from the $118,918 swing high to the $112,000 low.
However, the bears were active near the $115,500 resistance and the price struggled to continue higher. Bitcoin is now trading above $114,000 and the 100 hourly Simple moving average.
Immediate resistance on the upside is near the $115,000 level. The first key resistance is near the $115,500 level. The next resistance could be $116,250 or the 61.8% Fib retracement level of the move from the $118,918 swing high to the $112,000 low.
A close above the $116,250 resistance might send the price further higher. In the stated case, the price could rise and test the $117,500 resistance level. Any more gains might send the price toward the $118,000 level. The main target could be $120,000.
If Bitcoin fails to rise above the $115,500 resistance zone, it could start another decline. Immediate support is near the $114,200 level. The first major support is near the $113,500 level.
The next support is now near the $112,000 zone. Any more losses might send the price toward the $110,500 support in the near term. The main support sits at $108,500, below which BTC might continue to move down.
Technical indicators:
Hourly MACD – The MACD is now losing pace in the bearish zone.
Hourly RSI (Relative Strength Index) – The RSI for BTC/USD is now above the 50 level.
Major Support Levels – $113,500, followed by $112,000.
Major Resistance Levels – $115,500 and $117,500.
[#item_full_content]NewsBTCRead MoreThe Japanese firm, now the world's third largest publicly traded bitcoin holder, reported stronger Bitcoin…
Post ContentRead MoreCoinDesk: Bitcoin, Ethereum, Crypto News and Price Data[#item_full_content]
Long-term holding wallets have shifted to net accumulation from net distribution, according to Glassnode.Read MoreCoinDesk:…
Bitcoin climbed back above $60,000 for the first time in over a week after Fed…
Bitcoin Magazine Bitcoin Price Reclaims $60,000 As Strategy (MSTR) and Strive (ASST) Jump More Than…
Bitcoin Magazine AI’s Bitcoin Moment: Why the Open-Source Fight Looks Like Crypto Back in 2014…