Bitcoin price is attempting to recover above the $114,200 zone. BTC is now consolidating and might attempt to clear the $115,500 resistance zone.
Bitcoin started a recovery wave above the $113,500 zone.
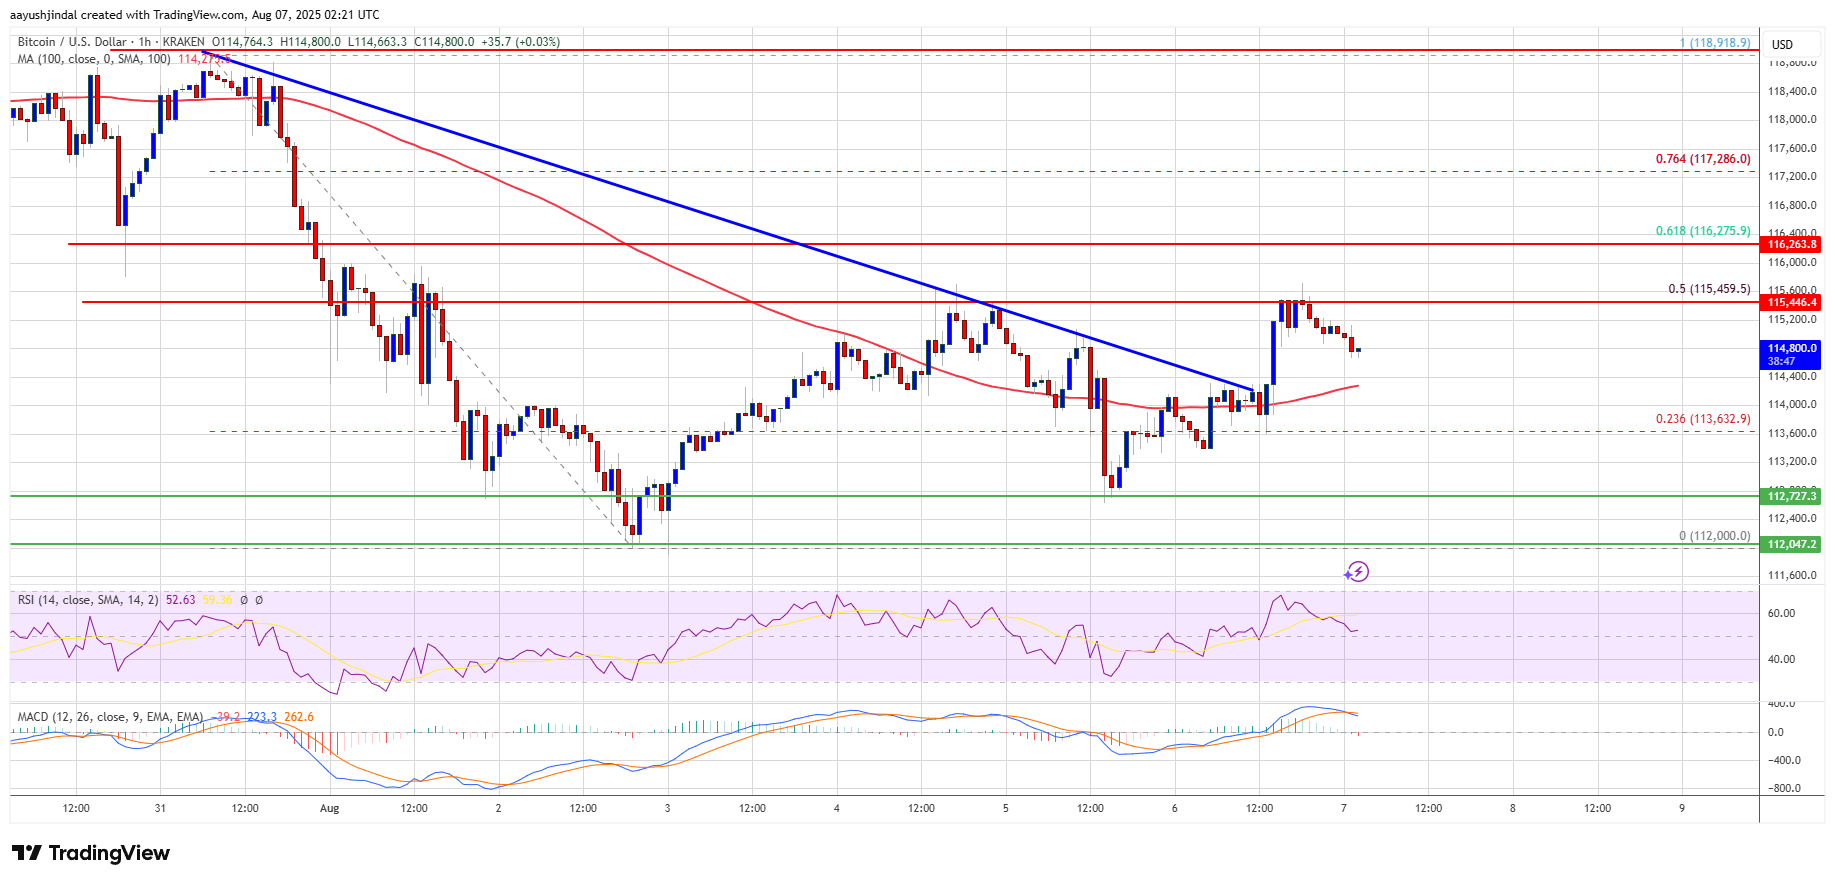
The price is trading above $114,000 and the 100 hourly Simple moving average.
There was a break above a bearish trend line with resistance at $114,300 on the hourly chart of the BTC/USD pair (data feed from Kraken).
The pair might start another increase if it clears the $115,500 resistance zone.
Bitcoin price found support near the $112,000 zone and started a recovery wave. BTC was able to climb above the $113,500 and $114,200 resistance levels.
Besides, there was a break above a bearish trend line with resistance at $114,300 on the hourly chart of the BTC/USD pair. The price climbed toward the 50% Fib retracement level of the move from the $118,918 swing high to the $112,000 low.
However, the bears were active near the $115,500 resistance and the price struggled to continue higher. Bitcoin is now trading above $114,000 and the 100 hourly Simple moving average.
Immediate resistance on the upside is near the $115,000 level. The first key resistance is near the $115,500 level. The next resistance could be $116,250 or the 61.8% Fib retracement level of the move from the $118,918 swing high to the $112,000 low.
A close above the $116,250 resistance might send the price further higher. In the stated case, the price could rise and test the $117,500 resistance level. Any more gains might send the price toward the $118,000 level. The main target could be $120,000.
If Bitcoin fails to rise above the $115,500 resistance zone, it could start another decline. Immediate support is near the $114,200 level. The first major support is near the $113,500 level.
The next support is now near the $112,000 zone. Any more losses might send the price toward the $110,500 support in the near term. The main support sits at $108,500, below which BTC might continue to move down.
Technical indicators:
Hourly MACD – The MACD is now losing pace in the bearish zone.
Hourly RSI (Relative Strength Index) – The RSI for BTC/USD is now above the 50 level.
Major Support Levels – $113,500, followed by $112,000.
Major Resistance Levels – $115,500 and $117,500.
[#item_full_content]NewsBTCRead MoreOver the past few days, the Bitcoin price has had one of its better performances…
Bitcoin is showing signs of weakening momentum as it struggles to regain higher ground, placing…
BlackRock’s Rick Rieder, UBS’s Ulrike Hoffmann-Burchardi and Third Point’s Daniel Loeb see steady economic growth…
The shift comes as stablecoins surge in popularity and competitors like Stripe and PayPal add…
Spot Bitcoin ETFs listed in the US recorded their steepest single-day outflow in nearly three…
The executive order to build President Donald Trump's Strategic Bitcoin Reserve has awaited congressional action,…