Bitcoin price extended losses and retested the $15,800 support. BTC could continue to move down towards the $15,000 and $14,000 levels.
Bitcoin started a fresh decline below the $16,000 and $15,800 levels.
The price is trading below $16,400 and the 100 hourly simple moving average.
There is a major bearish trend line forming with resistance near $16,150 on the hourly chart of the BTC/USD pair (data feed from Kraken).
The pair remains at a risk of more losses towards the $15,000 level or even $14,000.
Bitcoin price started a fresh decline from the $17,000 resistance. BTC gained bearish momentum after it settled below the $16,500 support zone.
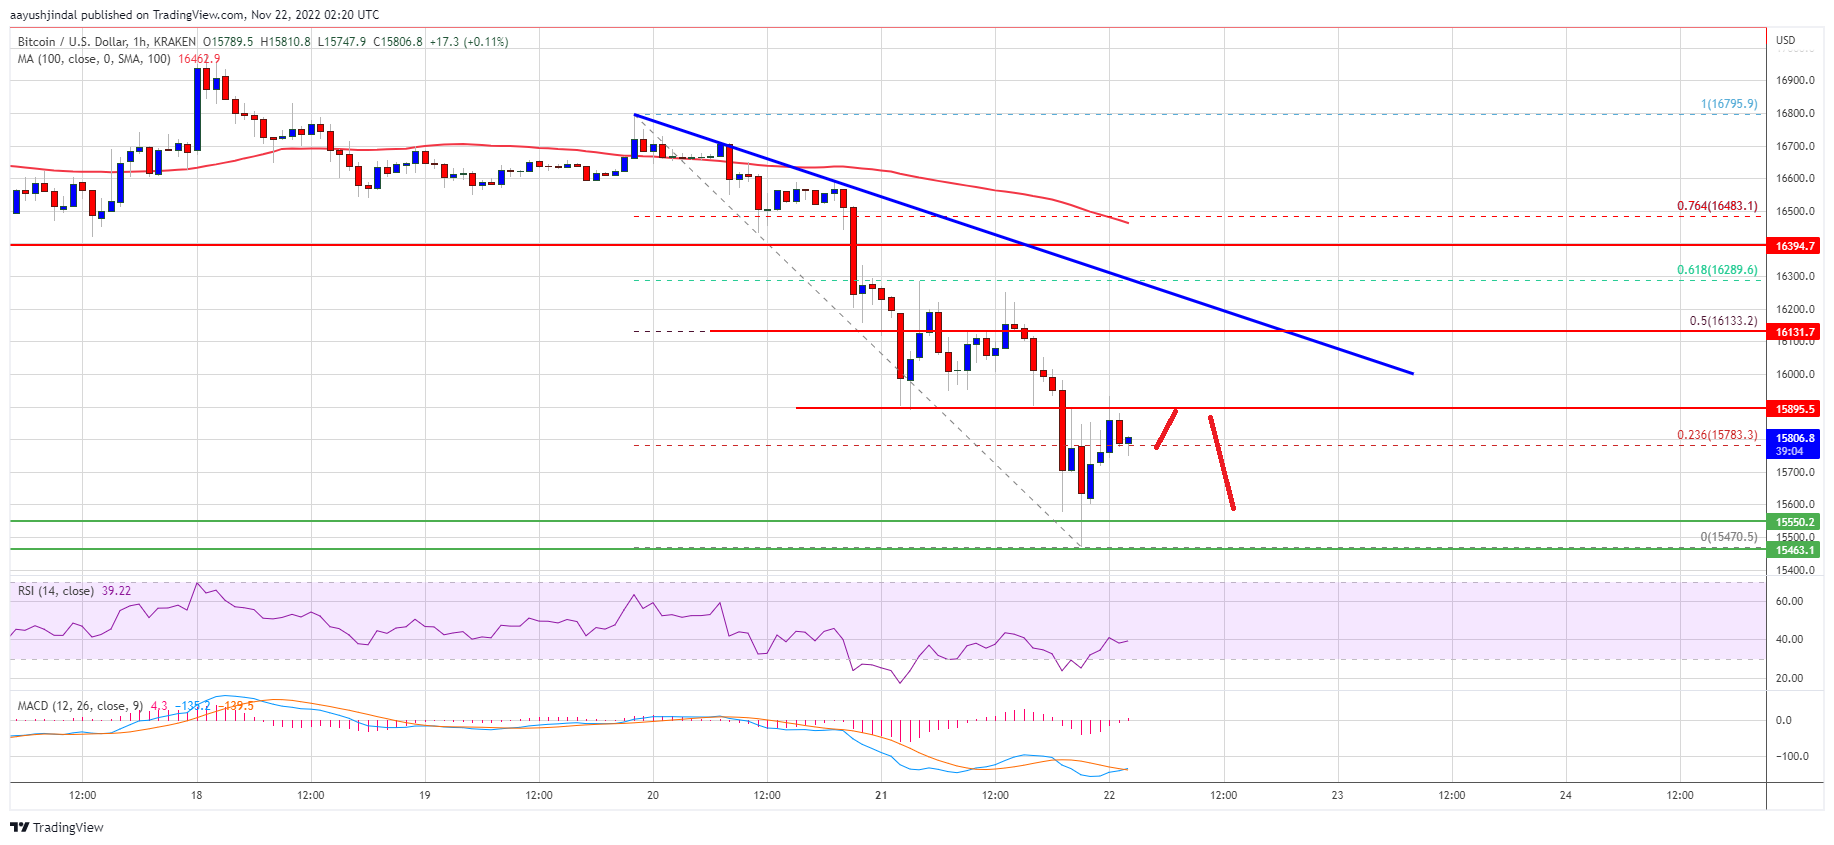
There was a move below the $16,000 level and the 100 hourly simple moving average. The bears were able to push the price towards the key $15,500 support zone. A low is formed near $15,470 and the price is now correcting losses.
There was a minor increase above the $15,800 resistance zone. Bitcoin price cleared the 23.6% Fib retracement level of the recent drop from the $16,795 swing high to $15,470 low.
On the upside, an immediate resistance is near the $15,880 level. The first major resistance is near the $16,150 zone. There is also a major bearish trend line forming with resistance near $16,150 on the hourly chart of the BTC/USD pair.
Source: BTCUSD on TradingView.com
The 50% Fib retracement level of the recent drop from the $16,795 swing high to $15,470 low. The next major resistance is near the $16,400 level. The price must clear the trend line resistance and then $16,400 to start a decent increase. The next major resistance is near $16,500, above which the price could gain pace for a move towards the $17,000 zone.
If bitcoin fails to recover above the $16,150 resistance zone, it could continue to move down. An immediate support on the downside is near the $15,650 level.
The next major support is near the $15,500 zone, below which the price might test the key support at $15,000. A clear move below the $15,000 support might send the price further lower, may be towards $13,200.
Technical indicators:
Hourly MACD – The MACD is now losing pace in the bearish zone.
Hourly RSI (Relative Strength Index) – The RSI for BTC/USD is now below the 50 level.
Major Support Levels – $15,650, followed by $15,500.
Major Resistance Levels – $16,150, $16,400 and $16,500.
Bitcoin price extended losses and retested the $15,800 support. BTC could continue to move down towards the $15,000 and $14,000 levels.
Bitcoin started a fresh decline below the $16,000 and $15,800 levels.
The price is trading below $16,400 and the 100 hourly simple moving average.
There is a major bearish trend line forming with resistance near $16,150 on the hourly chart of the BTC/USD pair (data feed from Kraken).
The pair remains at a risk of more losses towards the $15,000 level or even $14,000.
Bitcoin price started a fresh decline from the $17,000 resistance. BTC gained bearish momentum after it settled below the $16,500 support zone.
There was a move below the $16,000 level and the 100 hourly simple moving average. The bears were able to push the price towards the key $15,500 support zone. A low is formed near $15,470 and the price is now correcting losses.
There was a minor increase above the $15,800 resistance zone. Bitcoin price cleared the 23.6% Fib retracement level of the recent drop from the $16,795 swing high to $15,470 low.
On the upside, an immediate resistance is near the $15,880 level. The first major resistance is near the $16,150 zone. There is also a major bearish trend line forming with resistance near $16,150 on the hourly chart of the BTC/USD pair.
Source: BTCUSD on TradingView.com
The 50% Fib retracement level of the recent drop from the $16,795 swing high to $15,470 low. The next major resistance is near the $16,400 level. The price must clear the trend line resistance and then $16,400 to start a decent increase. The next major resistance is near $16,500, above which the price could gain pace for a move towards the $17,000 zone.
If bitcoin fails to recover above the $16,150 resistance zone, it could continue to move down. An immediate support on the downside is near the $15,650 level.
The next major support is near the $15,500 zone, below which the price might test the key support at $15,000. A clear move below the $15,000 support might send the price further lower, may be towards $13,200.
Technical indicators:
Hourly MACD – The MACD is now losing pace in the bearish zone.
Hourly RSI (Relative Strength Index) – The RSI for BTC/USD is now below the 50 level.
Major Support Levels – $15,650, followed by $15,500.
Major Resistance Levels – $16,150, $16,400 and $16,500.
Tags: bitcoinbitcoin pricebtcusdBTCUSDTxbtusd
NewsBTCRead More
Eased Middle East tensions pushed crypto prices and U.S. stocks sizable hjigher.Read MoreCoinDesk: Bitcoin, Ethereum,…
Bitcoin Magazine Bitcoin Could Be Quantum-Safe Without Protocol Changes, New Proposal Claims A new research…
Analyst Lance Vitanza is betting that digital asset treasury"companies like Nakamoto, SharpLink and Strive can…
Wall Street’s financial advisory machine now has a direct line to Bitcoin. Morgan Stanley Investment…
Crypto markets are showing early signs that the worst may be over, following a prolonged…
Bitcoin Magazine Tim Draper Confirmed as a Bitcoin 2026 Speaker Tim Draper has been officially…