Bitcoin price is showing bearish signs below the $28,000 zone. BTC must clear $28,000 to avoid more losses in the coming sessions.
Bitcoin struggled to gain pace above the $28,000 resistance zone.
The price is trading below $27,800 and the 100 hourly Simple moving average.
There is a connecting bearish trend line forming with resistance near $27,650 on the hourly chart of the BTC/USD pair (data feed from Kraken).
The pair could start a decent recovery wave if there is a close above $28,000.
Bitcoin price found support near the $27,200 zone and started an upside correction. BTC climbed above the $27,800 level but upsides were limited.
It tested the $28,000 resistance zone. A high was formed near $28,000 and the price reacted to the downside. It broke the $27,200 support zone and tested $27,000. A low is formed near $26,969 and the price is again attempting an upside correction.
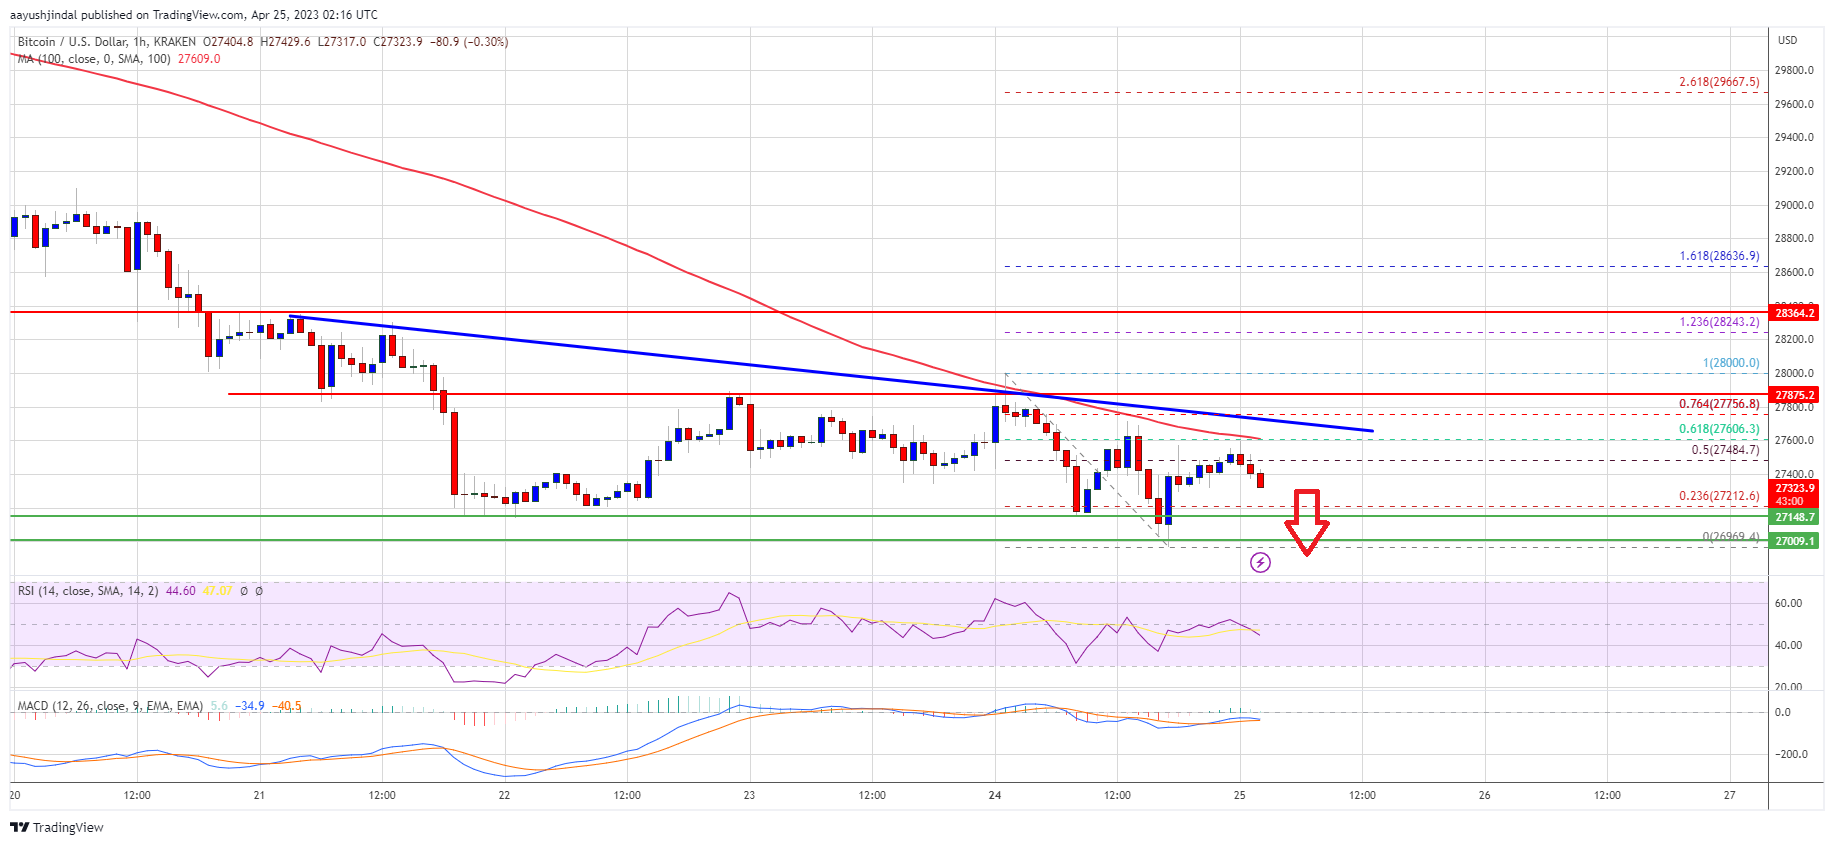
Bitcoin climbed above the 50% Fib retracement level of the recent decline from the $28,000 high to the $26,969 low. However, it is still trading below $27,800 and the 100 hourly Simple moving average.
Besides, there is a connecting bearish trend line forming with resistance near $27,650 on the hourly chart of the BTC/USD pair. Immediate resistance is near the $27,650 level and the trend line. The trend line coincides with the 61.8% Fib retracement level of the recent decline from the $28,000 high to the $26,969 low.
Source: BTCUSD on TradingView.com
The next major resistance sits near the $28,000 zone. A close above the $28,000 resistance could start a decent increase. In the stated case, the price may perhaps rise toward the $28,400 resistance zone. Any more gains could open the doors for a test of $29,200.
If Bitcoin’s price fails to clear the $27,650 resistance, it could continue to move down. Immediate support on the downside is near the $27,100 level.
The next major support is near the $27,000 zone. A downside break and close below the $27,000 support might push the price toward the $26,500 support. Any more losses might take Bitcoin toward $26,000.
Technical indicators:
Hourly MACD – The MACD is now gaining pace in the bearish zone.
Hourly RSI (Relative Strength Index) – The RSI for BTC/USD is now below the 50 level.
Major Support Levels – $27,100, followed by $27,000.
Major Resistance Levels – $27,650, $28,000, and $28,400.
[#item_full_content]NewsBTCRead MoreOn‑chain trackers showed GameStop’s $324 million worth of bitcoin leaving its wallets for Coinbase. Many…
Liquidation heatmap shows large liquidity cluster around $66,000, signaling potential downside target.Read MoreCoinDesk: Bitcoin, Ethereum,…
ETFs show institutional demand for bitcoin is cooling after a strong start to the month.Read…
Ukraine’s disruption of Russian oil flows has added fresh uncertainty to already strained energy markets,…
On-chain analytics firm CryptoQuant has pointed out how Bitcoin has tended to revisit or stay…
Every major is red on the day as the war enters its fifth week with…