Bitcoin price is struggling below $27,500. BTC is now at risk of a downside break unless there is a close above the $27,500 resistance.
Bitcoin started another decline and traded below the $26,800 level.
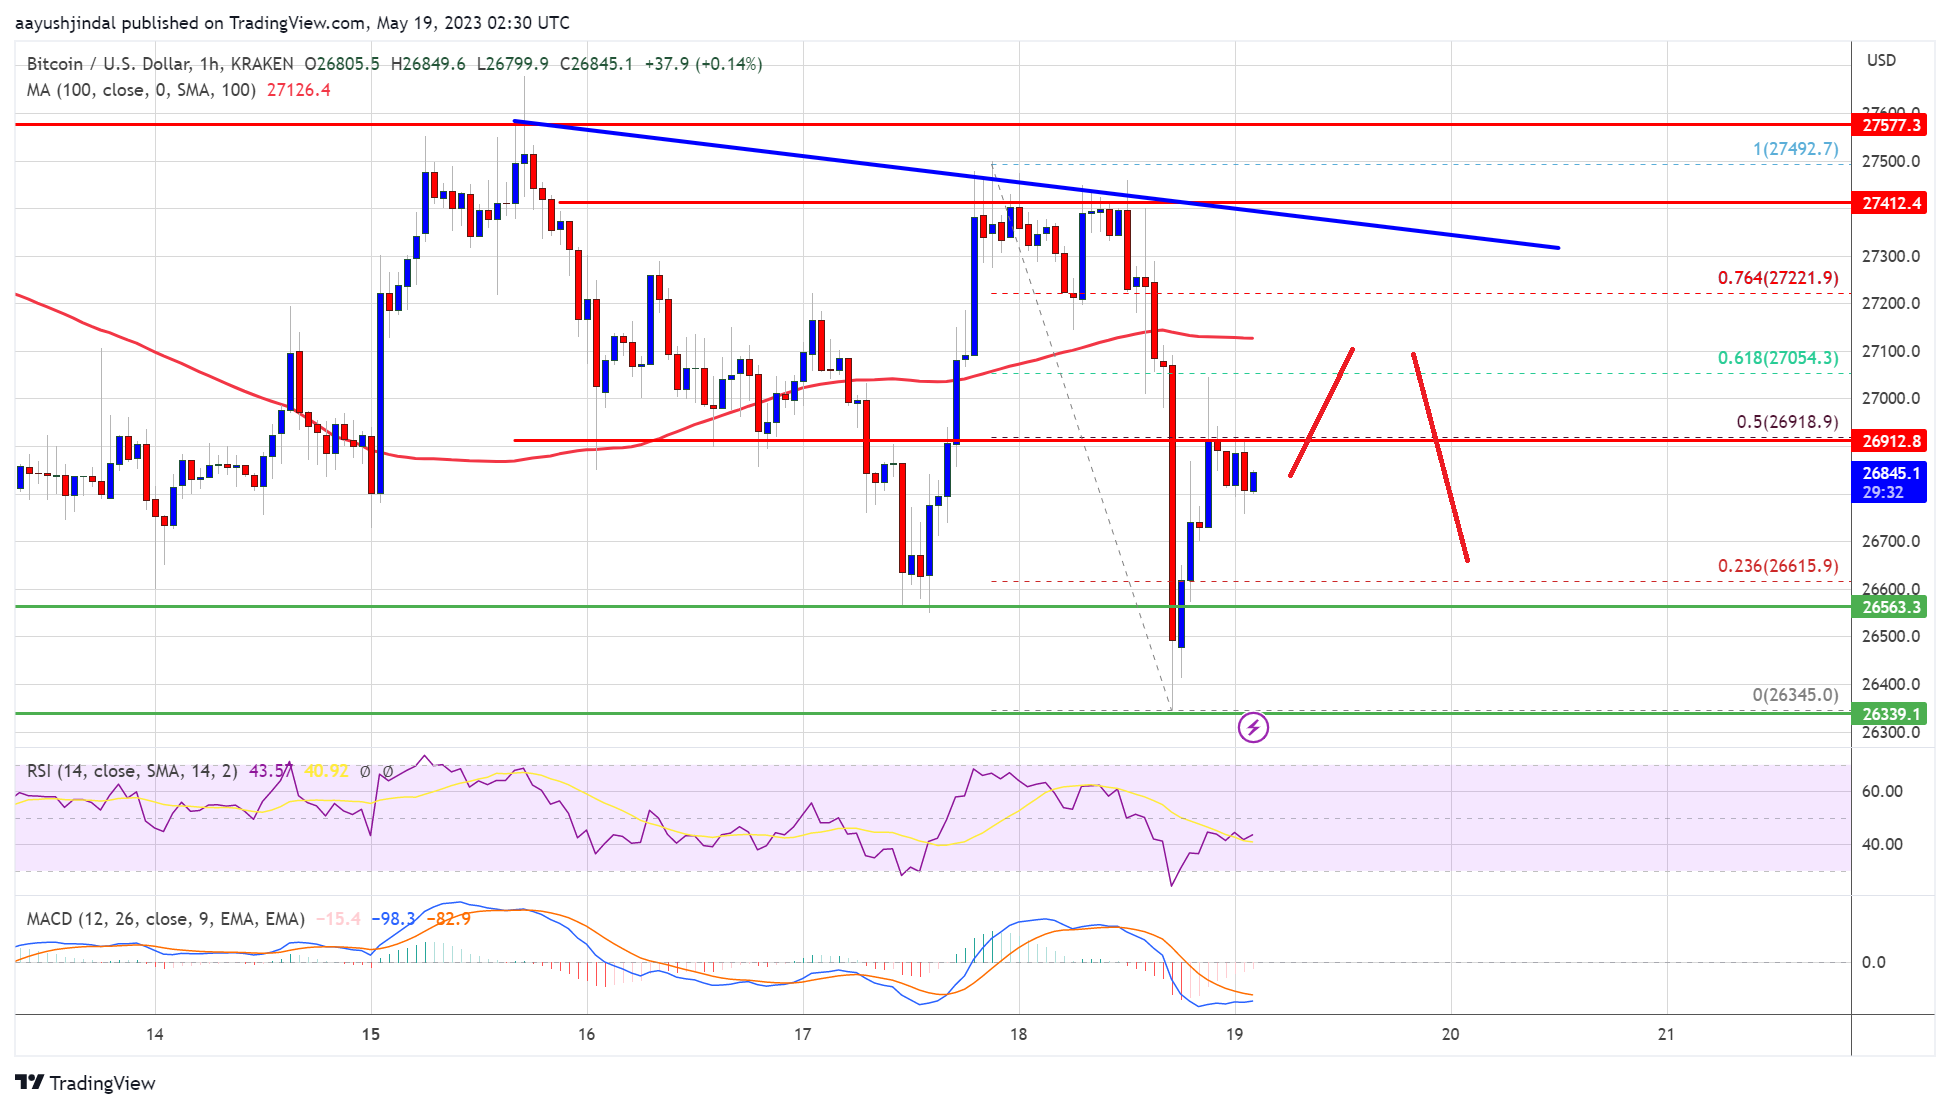
The price is trading below $27,200 and the 100 hourly Simple moving average.
There is a key bearish trend line forming with resistance near $27,320 on the hourly chart of the BTC/USD pair (data feed from Kraken).
The pair could start a fresh rally if it clears the $27,320 and $27,500 resistance levels.
Bitcoin price started a fresh decline below the $27,200 level. BTC even traded below the $26,550 support zone to set a new weekly low.
A low is formed near $26,345 and the price is now attempting a fresh increase. There was a move above the 23.6% Fib retracement level of the recent decline from the $27,492 swing high to the $26,345 low. It is now trading below $27,200 and the 100 hourly Simple moving average.
There is also a key bearish trend line forming with resistance near $27,320 on the hourly chart of the BTC/USD pair. Bitcoin price is now struggling to clear the $27,000 resistance.
It is facing barriers near the 50% Fib retracement level of the recent decline from the $27,492 swing high to the $26,345 low. The next major resistance is near the $27,320 level and the trend line. A close above the $27,320 resistance might reduce selling pressure.
Source: BTCUSD on TradingView.com
The next key resistance is near $27,550, above which the price might gain bullish momentum and test the $28,000 resistance. Any more gains might send the price toward the $28,500 level.
If Bitcoin’s price fails to clear the $27,320 resistance, it could start a fresh decline. Immediate support on the downside is near the $26,550 level.
The next major support is near the $26,350 zone, below which the price might gain bearish momentum. In the stated case, it could test the $26,000 level. Any more losses might take Bitcoin toward the $25,500 level in the near term.
Technical indicators:
Hourly MACD – The MACD is now losing pace in the bearish zone.
Hourly RSI (Relative Strength Index) – The RSI for BTC/USD is now below the 50 level.
Major Support Levels – $26,550, followed by $26,350.
Major Resistance Levels – $27,000, $27,320, and $27,500.
[#item_full_content]NewsBTCRead MoreFor readers tracking where the market is actually changing, this is the part that matters.…
The headline number is useful, but the real story is what it says about positioning.…
Bitcoin Magazine Bitcoin Exchange Inflows Spike to 49,000 BTC in a Day, Signaling More Volatility…
Bitcoin Magazine Wavespace Launches MiCA-Compliant Self-Custodial Bitcoin Debit Card Powered by Lightning and NWC Wavespace,…
For readers tracking where the market is actually changing, this is the part that matters.…
The headline number is useful, but the real story is what it says about positioning.…