Bitcoin price is struggling below $27,500. BTC is now at risk of a downside break unless there is a close above the $27,500 resistance.
Bitcoin started another decline and traded below the $26,800 level.
The price is trading below $27,200 and the 100 hourly Simple moving average.
There is a key bearish trend line forming with resistance near $27,320 on the hourly chart of the BTC/USD pair (data feed from Kraken).
The pair could start a fresh rally if it clears the $27,320 and $27,500 resistance levels.
Bitcoin price started a fresh decline below the $27,200 level. BTC even traded below the $26,550 support zone to set a new weekly low.
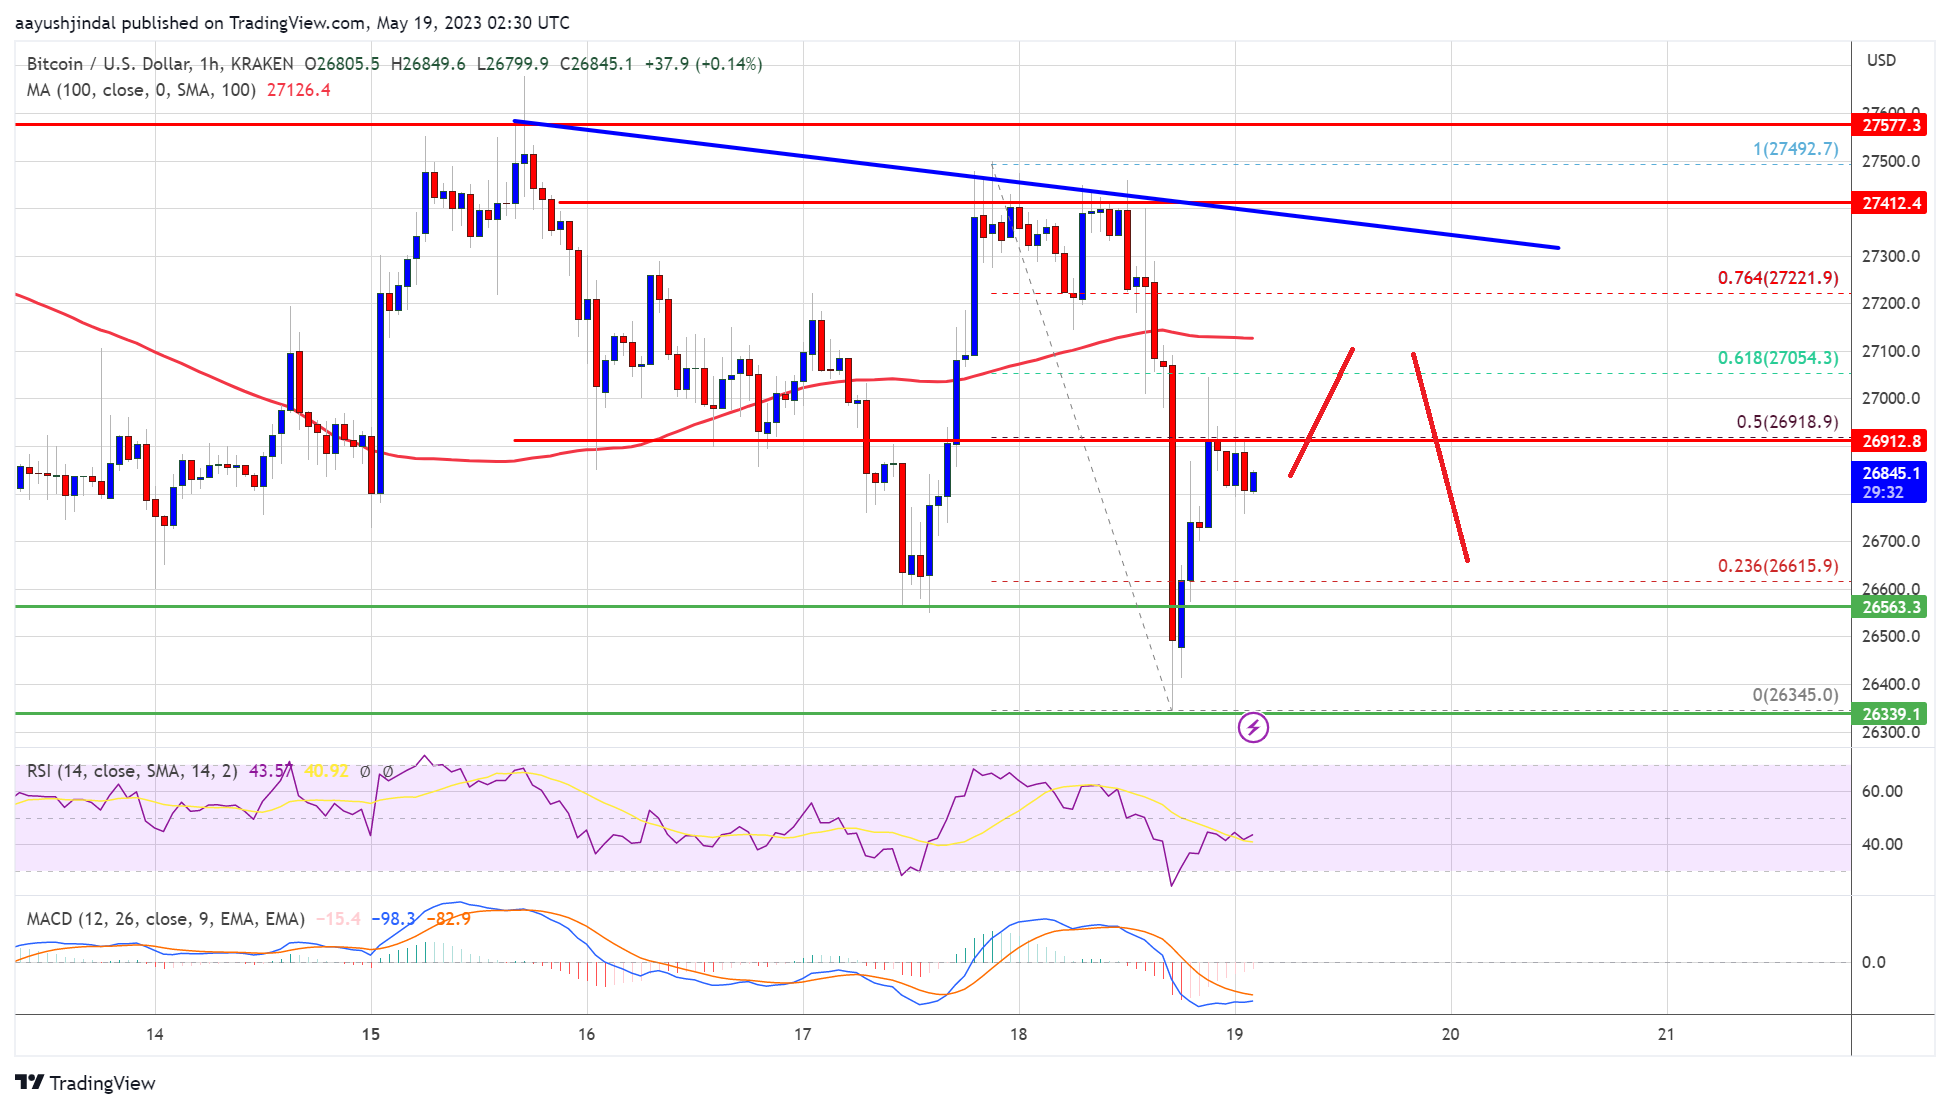
A low is formed near $26,345 and the price is now attempting a fresh increase. There was a move above the 23.6% Fib retracement level of the recent decline from the $27,492 swing high to the $26,345 low. It is now trading below $27,200 and the 100 hourly Simple moving average.
There is also a key bearish trend line forming with resistance near $27,320 on the hourly chart of the BTC/USD pair. Bitcoin price is now struggling to clear the $27,000 resistance.
It is facing barriers near the 50% Fib retracement level of the recent decline from the $27,492 swing high to the $26,345 low. The next major resistance is near the $27,320 level and the trend line. A close above the $27,320 resistance might reduce selling pressure.
Source: BTCUSD on TradingView.com
The next key resistance is near $27,550, above which the price might gain bullish momentum and test the $28,000 resistance. Any more gains might send the price toward the $28,500 level.
If Bitcoin’s price fails to clear the $27,320 resistance, it could start a fresh decline. Immediate support on the downside is near the $26,550 level.
The next major support is near the $26,350 zone, below which the price might gain bearish momentum. In the stated case, it could test the $26,000 level. Any more losses might take Bitcoin toward the $25,500 level in the near term.
Technical indicators:
Hourly MACD – The MACD is now losing pace in the bearish zone.
Hourly RSI (Relative Strength Index) – The RSI for BTC/USD is now below the 50 level.
Major Support Levels – $26,550, followed by $26,350.
Major Resistance Levels – $27,000, $27,320, and $27,500.
[#item_full_content]NewsBTCRead MoreCrypto analyst Minga has predicted that the Bitcoin price could rally past $120,000 to a…
The negative gamma zone below $68,000 can trigger a self-reinforcing sell-off, leading to an ever…
Crude oil climbed back above $100 a barrel and Bitcoin slipped as US President Donald…
In the middle of a surge higher following President Trump's overnight comments, the price of…
Bitcoin Magazine Bitcoin Treasuries Are Cracking as Public Companies Turn into BTC Sellers A wave…
Bitcoin Magazine Bitcoin Price Continues Sliding as President Trump Signals Iran Escalation, Raising Risk of…