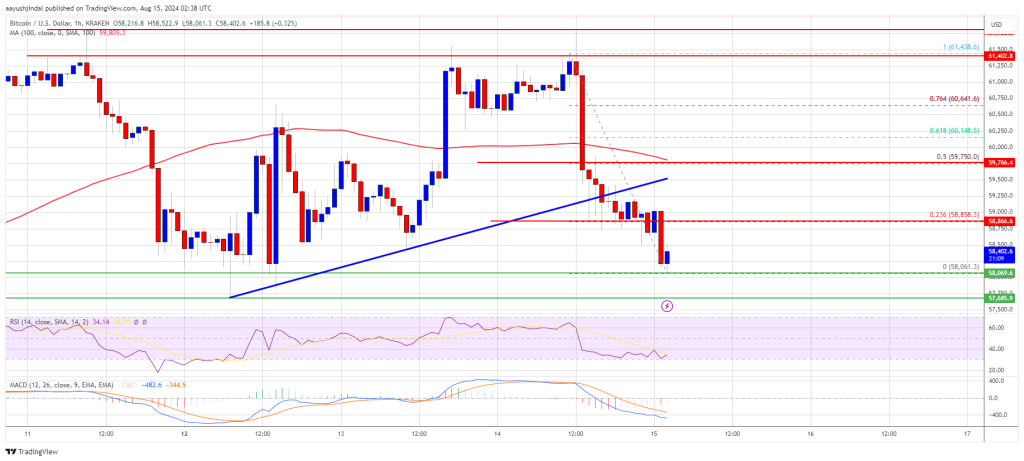
Bitcoin price failed to clear the $61,500 resistance zone. BTC is now retesting the $58,000 support and might attempt a fresh increase.
Bitcoin started a fresh decline from the $61,500 resistance zone.
The price is trading below $60,000 and the 100 hourly Simple moving average.
There was a break below a key bullish trend line with support at $59,250 on the hourly chart of the BTC/USD pair (data feed from Kraken).
The pair might attempt a fresh increase if it stays above the $58,000 zone.
Bitcoin price failed to settle above the $61,500 resistance zone. BTC formed a short-term top and started a fresh decline below the $60,500 level. There was a move below the $60,000 and $59,000 levels.
Besides, there was a break below a key bullish trend line with support at $59,250 on the hourly chart of the BTC/USD pair. The pair retested the $58,000 support zone. A low is formed at $58,061 and the price is now consolidating losses.
Bitcoin price is now trading below $60,000 and the 100 hourly Simple moving average. On the upside, the price could face resistance near the $58,800 level. It is close to the 23.6% Fib retracement level of the downward move from the $61,438 swing high to the $58,061 low.
The first key resistance is near the $59,500 level or the 50% Fib retracement level of the downward move from the $61,438 swing high to the $58,061 low A clear move above the $59,500 resistance might send the price further higher in the coming sessions. The next key resistance could be $60,000.
The next major hurdle sits at $61,500. A close above the $61,500 resistance might spark more upsides. In the stated case, the price could rise and test the $63,500 resistance.
If Bitcoin fails to rise above the $58,800 resistance zone, it could continue to move down. Immediate support on the downside is near the $58,000 level.
The first major support is $57,650. The next support is now near the $56,500 zone. Any more losses might send the price toward the $55,500 support zone or even $55,000 in the near term.
Technical indicators:
Hourly MACD – The MACD is now gaining pace in the bearish zone.
Hourly RSI (Relative Strength Index) – The RSI for BTC/USD is now below the 50 level.
Major Support Levels – $58,000, followed by $57,650.
Major Resistance Levels – $58,800, and $59,500.
[#item_full_content]NewsBTCRead MoreBitcoin Magazine Bitcoin Has a Golden Opportunity With AI Agents, It’s Time to Build For…
Bitcoin’s rally back to the mid-$73,000 region did not last long as the leading cryptocurrency’s…
Bitcoin Magazine Coinbase Launches Regulated Bitcoin and Crypto Futures Across Europe Coinbase has rolled out…
Bitcoin Magazine Bitcoin Price Teeters Near $69,000 Despite Market Volatility and Oil Price Swings Bitcoin…
Bitcoin Magazine Public Bitcoin Miners are Dumping Bitcoin for AI, a Historic Mistake There is…
WTI crude oil, which soared nearly 30% to $120 per barrel overnight, has pulled back…