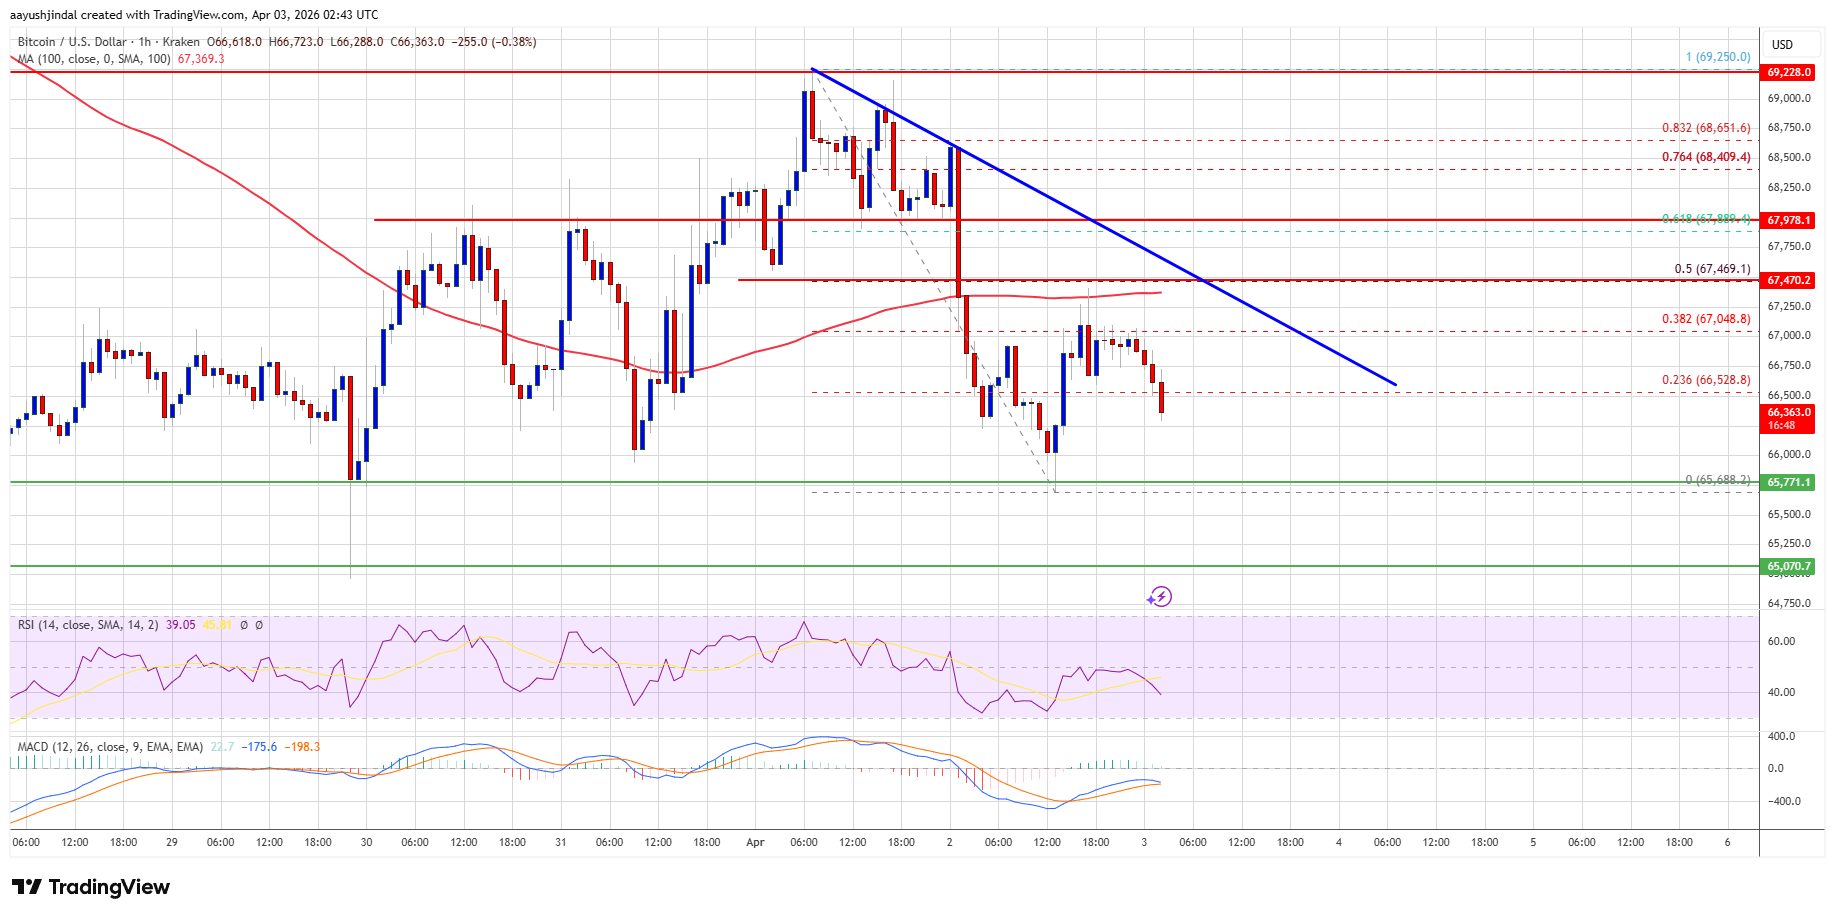
Bitcoin price started a fresh decline from the $69,250 zone. BTC is now struggling to stay above $66,000 and might extend losses in the near term.
Bitcoin failed to settle above $68,000 and started a fresh decline.
The price is trading below $67,000 and the 100 hourly simple moving average.
There is a bearish trend line forming with resistance at $67,450 on the hourly chart of the BTC/USD pair (data feed from Kraken).
The pair might start another decline if it stays below the $67,500 and $67,800 levels.
Bitcoin price failed to stay above the $68,800 zone and started a fresh decline. BTC traded below $68,200 and $68,000 to enter a bearish zone.
The bears even pushed the price below $67,000. A low was formed at $65,688, and the price is now consolidating losses below the 23.6% Fib retracement level of the downward move from the $69,250 swing high to the $65,688 low.
Bitcoin is now trading below $67,000 and the 100 hourly simple moving average. If the price remains stable above $65,500, it could attempt a fresh increase. Immediate resistance is near the $67,000 level.
The first key resistance is near the $67,500 level or the 50% Fib retracement level of the downward move from the $69,250 swing high to the $65,688 low. There is also a bearish trend line forming with resistance at $67,450 on the hourly chart of the BTC/USD pair.
A close above the $67,500 resistance might send the price further higher. In the stated case, the price could rise and test the $68,000 resistance. Any more gains might send the price toward the $68,500 level. The next barrier for the bulls could be $68,800.
If Bitcoin fails to rise above the $67,500 resistance zone, it could start another decline. Immediate support is near the $66,000 level. The first major support is near the $65,500 level.
The next support is now near the $65,000 zone. Any more losses might send the price toward the $64,200 support in the near term. The main support now sits at $63,500, below which BTC might struggle to recover in the near term.
Technical indicators:
Hourly MACD – The MACD is now gaining pace in the bearish zone.
Hourly RSI (Relative Strength Index) – The RSI for BTC/USD is now below the 50 level.
Major Support Levels – $66,000, followed by $65,500.
Major Resistance Levels – $67,500 and $68,000.
[#item_full_content]NewsBTCRead MoreA prominent crypto analyst is pointing to similarities between Cardano’s current market position and Bitcoin’s…
The ongoing tensions in the Middle East continue to put immense pressure on Bitcoin and…
Bitcoin Magazine MARA Conducts Ongoing Layoffs Following $1.1B Bitcoin Sale and Debt Reduction Push Bitcoin…
Crypto analyst Minga has predicted that the Bitcoin price could rally past $120,000 to a…
The negative gamma zone below $68,000 can trigger a self-reinforcing sell-off, leading to an ever…
Crude oil climbed back above $100 a barrel and Bitcoin slipped as US President Donald…