Bitcoin price is slowly moving higher above the $56,500 level. BTC might gain bullish momentum if it clears the $58,500 resistance zone.
Bitcoin started a recovery wave above the $56,500 and $57,000 levels.
The price is trading above $57,000 and the 100 hourly Simple moving average.
There is a connecting bullish trend line forming with support at $57,200 on the hourly chart of the BTC/USD pair (data feed from Kraken).
The pair might start a fresh increase above the $58,500 resistance zone.
Bitcoin price started a recovery wave above the $56,500 level. BTC even climbed above the $57,500 level. However, the bears are again active near the $58,500 resistance zone.
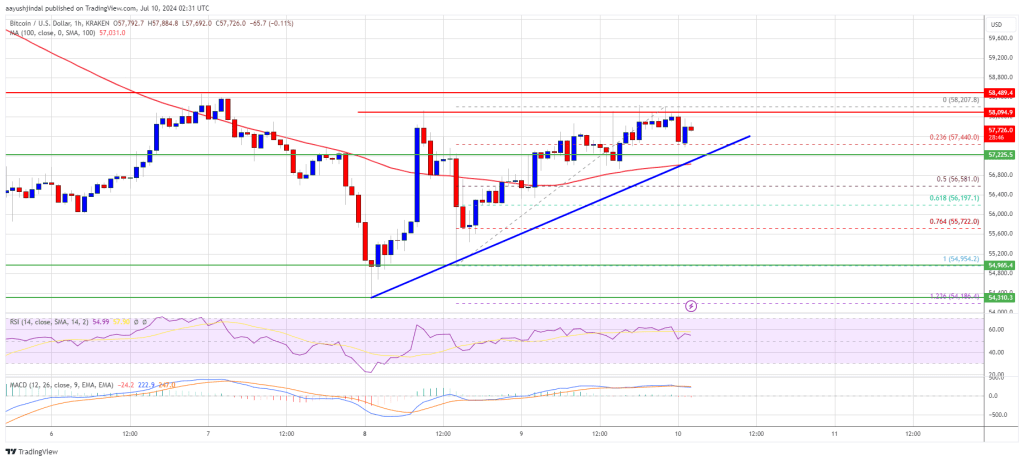
A high was formed at $58,200 and the price is now consolidating in a range. It also tested the 23.6% Fib retracement level of the upward move from the $54,955 swing low to the $58,200 high. The bulls seem to be active above the $57,000 level.
Bitcoin price is now trading above $57,200 and the 100 hourly Simple moving average. There is also a connecting bullish trend line forming with support at $57,200 on the hourly chart of the BTC/USD pair. Immediate resistance on the upside is near the $58,200 level.
The first key resistance is near the $58,500 level. A clear move above the $58,500 resistance might start a decent increase in the coming sessions. The next key resistance could be $59,200. A close above the $59,200 resistance might start a steady increase and send the price higher. In the stated case, the price could rise and test the $60,000 resistance. Any more gains might be difficult.
If Bitcoin fails to climb above the $58,500 resistance zone, it could start another decline. Immediate support on the downside is near the $57,400 level.
The first major support is $57,200 and the trend line. The next support is now near $56,200 and the 61.8% Fib retracement level of the upward move from the $54,955 swing low to the $58,200 high. Any more losses might send the price toward the $55,000 support zone in the near term.
Technical indicators:
Hourly MACD – The MACD is now losing pace in the bearish zone.
Hourly RSI (Relative Strength Index) – The RSI for BTC/USD is now above the 50 level.
Major Support Levels – $57,200, followed by $56,200.
Major Resistance Levels – $58,200, and $58,500.
[#item_full_content]NewsBTCRead MoreCryptoQuant’s 30-day apparent demand indicator is negative, signaling that buyers aren’t absorbing the available supply…
ASST climbs 133% in three months as Strive grows holdings to 16,500 BTC and explores…
Digital asset investment products shed $1.47 billion in a single week — the second consecutive…
Your day-ahead look for May 26, 2026Read MoreCoinDesk: Bitcoin, Ethereum, Crypto News and Price Data[#item_full_content]
The bitcoin price chart is forming a potential lower high while ether languishes in a…
Heavy supply concentration and large options positioning continue to suppress volatility and keep bitcoin range-bound.Read…