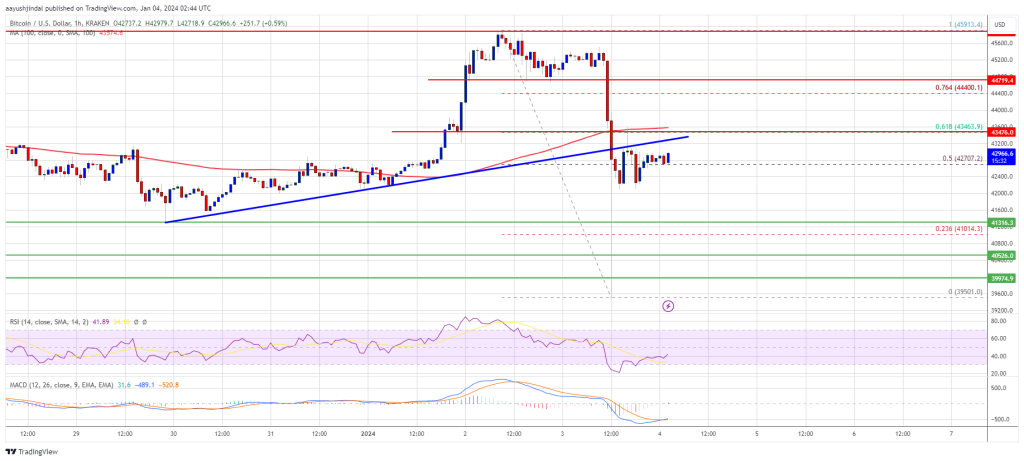
Bitcoin price started a major drop below $44,000 after rumors of spot ETF rejection. BTC dived over 10%, but the bulls are still protecting the $40,000 support.
Bitcoin declined heavily and even spiked below the $40,000 level.
The price is trading below $43,500 and the 100 hourly Simple moving average.
There was a break below a key bullish trend line with support near $43,200 on the hourly chart of the BTC/USD pair (data feed from Kraken).
The pair could start a fresh increase if there is a close above the $43,500 resistance zone.
Bitcoin price struggled to gain pace for a move above the $46,000 resistance level. BTC found a strong selling interest and then rumors of spot ETF rejection hit market.
It sparked bearish moves and the price tumbled below the $44,000 level. There was a break below a key bullish trend line with support near $43,200 on the hourly chart of the BTC/USD pair. The pair declined over 10% and even spiked below the $40,000 support.
A low was formed near $39,500 and the price started a recovery wave. There was a move above the $41,500 and $42,000 levels. There was a wave above the 50% Fib retracement level of the downward move from the $45,913 swing high to the $39,501 low.
Bitcoin is trading below $43,500 and the 100 hourly Simple moving average. On the upside, immediate resistance is near the $43,200 level. The first major resistance is $43,500 or the 61.8% Fib retracement level of the downward move from the $45,913 swing high to the $39,501 low.
Source: BTCUSD on TradingView.com
A close above the $43,500 level could send the price further higher. The next major resistance sits at $44,400. Any more gains above the $44,400 level could open the doors for a move toward the $45,000 level.
If Bitcoin fails to rise above the $43,500 resistance zone, it could start a fresh decline. Immediate support on the downside is near the $42,000 level.
The next major support is near $41,300. If there is a move below $41,300, the price could gain bearish momentum. In the stated case, the price could drop toward the $40,500 support in the near term.
Technical indicators:
Hourly MACD – The MACD is now losing pace in the bullish zone.
Hourly RSI (Relative Strength Index) – The RSI for BTC/USD is now below the 50 level.
Major Support Levels – $42,000, followed by $41,300.
Major Resistance Levels – $43,200, $43,500, and $44,000.
[#item_full_content]NewsBTCRead MoreThis cycle, about $697 billion in new money has generated a roughly 689% gain, compared…
Your day-ahead look for July 3, 2026Read MoreCoinDesk: Bitcoin, Ethereum, Crypto News and Price Data[#item_full_content]
U.S. institutional demand had its worst month ever in June. Large holders absorbed the selling,…
Crypto ETF flows are starting to tell a more complicated story than simple risk-on or…
After dominating markets in 2026, AI-tied memory and semiconductor stocks are losing momentum, raising the…
Post ContentRead MoreCoinDesk: Bitcoin, Ethereum, Crypto News and Price Data[#item_full_content]