Bitcoin price failed to continue higher above the $63,650 resistance zone. BTC is now correcting gains and might revisit the $60,850 support.
Bitcoin started a downside correction from the $63,650 resistance zone.
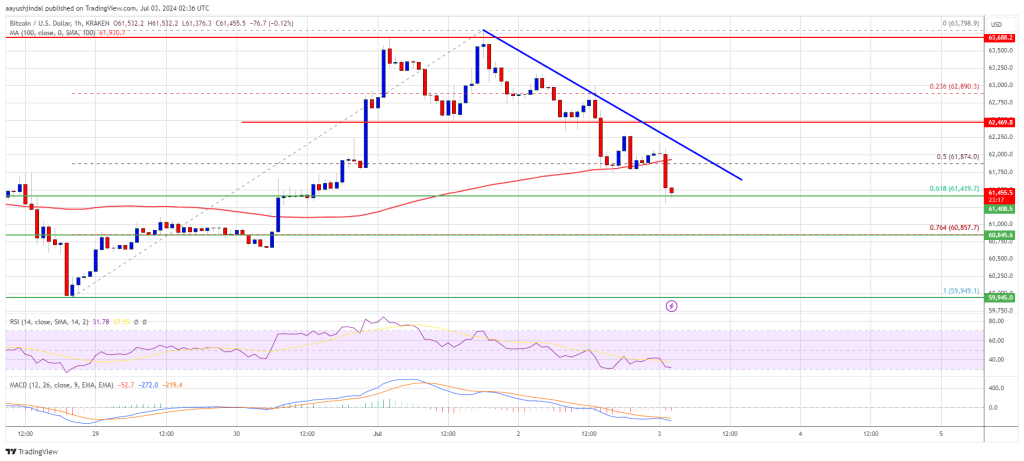
The price is trading below $62,500 and the 100 hourly Simple moving average.
There is a connecting bearish trend line forming with resistance at $61,850 on the hourly chart of the BTC/USD pair (data feed from Kraken).
The pair might struggle to start a fresh increase above the $62,250 resistance zone.
Bitcoin price struggled to extend gains above the $63,650 and $63,800 resistance levels. A high was formed at $63,798 and the price started a downside correction.
The price declined below the $63,000 level. The bears were able to push it below the $62,500 level and the 100 hourly Simple moving average. There was also a move below the 50% Fib retracement level of the upward move from the $59,951 swing low to the $63,798 high.
Bitcoin price is now trading below $62,500 and the 100 hourly Simple moving average. There is also a connecting bearish trend line forming with resistance at $61,850 on the hourly chart of the BTC/USD pair.
The bulls are now trying to protect the $61,400 zone and the 61.8% Fib retracement level of the upward move from the $59,951 swing low to the $63,798 high. If there is another increase, the price could face resistance near the $61,850 level and the trend line.
The first key resistance is near the $62,250 level. The next key resistance could be $62,500. A clear move above the $62,500 resistance might start a steady increase and send the price higher.
In the stated case, the price could rise and test the $63,250 resistance. Any more gains might send BTC toward the $63,650 resistance in the near term.
If Bitcoin fails to climb above the $62,250 resistance zone, it could continue to move down. Immediate support on the downside is near the $61,400 level.
The first major support is $60,850. The next support is now forming near $60,500. Any more losses might send the price toward the $60,000 support zone in the near term.
Technical indicators:
Hourly MACD – The MACD is now gaining pace in the bearish zone.
Hourly RSI (Relative Strength Index) – The RSI for BTC/USD is now below the 50 level.
Major Support Levels – $61,400, followed by $60,850.
Major Resistance Levels – $62,250, and $62,500.
[#item_full_content]NewsBTCRead MoreThe XRP price traded at around $1.30 on Monday as markets consolidated and Bitcoin (BTC)…
The new rollout converts BTC to dollars by default for small businesses, aiming to embed…
The Bitcoin price could be on the verge of a major surge as new discussions…
Satoshis per share climbs past 660, reinforcing rapid treasury expansion since Nasdaq debut.Read MoreCoinDesk: Bitcoin,…
Bitcoin Magazine Square Begins Automatic Bitcoin Payment Rollout to Millions of U.S. Merchants Square, the…
The first-quarter decline breaks a long-standing growth trend, but could ultimately support decentralization as public…