Bitcoin price started a fresh increase from the $105,200 zone. BTC is now consolidating and might struggle to continue higher above the $110,000 resistance.
Bitcoin started a fresh increase above the $108,000 zone.
The price is trading above $107,500 and the 100 hourly Simple moving average.
There was a break above a bearish trend line with resistance at $106,300 on the hourly chart of the BTC/USD pair (data feed from Kraken).
The pair could start a fresh increase if it stays above the $107,000 zone.
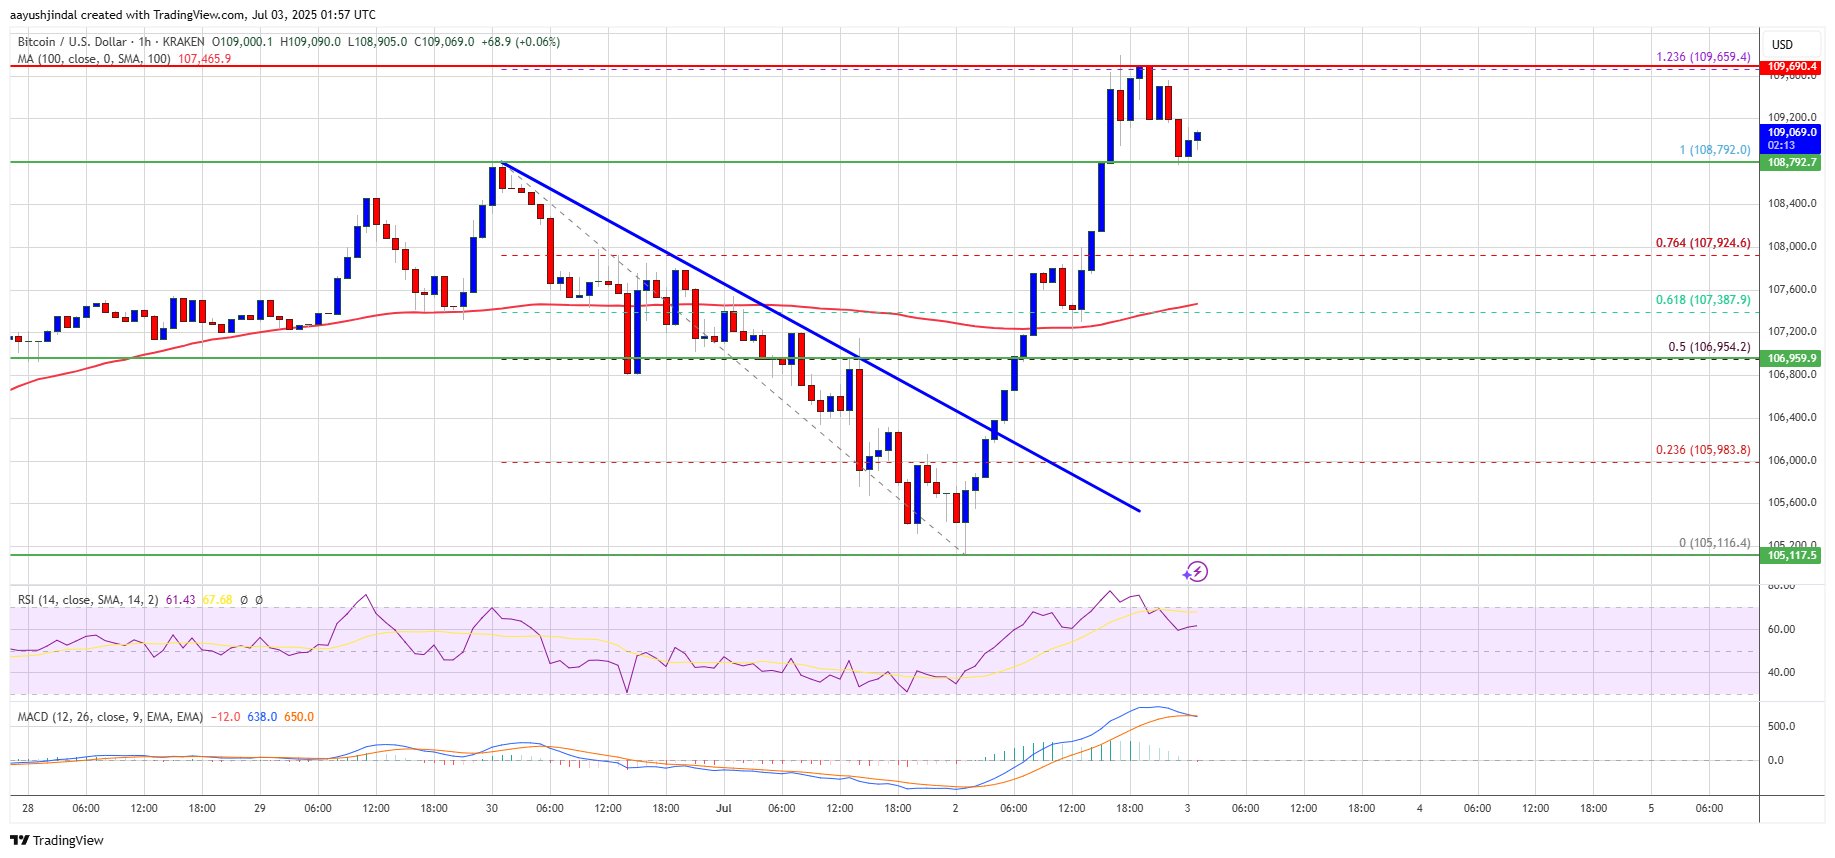
Bitcoin price remained supported above the $105,000 level and started a fresh increase. BTC cleared many hurdles near $106,200 to start a decent increase.
There was a break above a bearish trend line with resistance at $106,300 on the hourly chart of the BTC/USD pair. The pair pumped above the $107,500 resistance level. It cleared the 76.4% Fib retracement level of the downward move from the $108,792 swing high to the $105,116 low.
Finally, the price surged toward the $110,000 level. It tested the 1.236 Fib extension level of the downward move from the $108,792 swing high to the $105,116 low.
Bitcoin is now trading above $108,000 and the 100 hourly Simple moving average. On the upside, immediate resistance is near the $109,400 level. The first key resistance is near the $110,000 level. A close above the $110,000 resistance might send the price further higher. In the stated case, the price could rise and test the $112,000 resistance level. Any more gains might send the price toward the $113,200 level.
If Bitcoin fails to rise above the $110,000 resistance zone, it could start another decline. Immediate support is near the $108,750 level. The first major support is near the $108,000 level.
The next support is now near the $107,200 zone. Any more losses might send the price toward the $106,500 support in the near term. The main support sits at $105,000, below which BTC might continue to move down.
Technical indicators:
Hourly MACD – The MACD is now losing pace in the bullish zone.
Hourly RSI (Relative Strength Index) – The RSI for BTC/USD is now above the 50 level.
Major Support Levels – $108,000, followed by $107,200.
Major Resistance Levels – $110,000 and $112,000.
[#item_full_content]NewsBTCRead MoreBitcoin Magazine From 40 Meetups a Month to Nationwide Freedom: Bitcoin Indonesia’s Real-Life Comeback Boasting…
Bitcoin’s long-term price outlook is a major talking point, with veteran trader Peter Brandt recently…
Bitcoin Magazine French Energy Giant Engie Eyes Bitcoin Mining at Brazil Mega Solar Project French…
A spokesperson for Laurore said the $436 million IBIT stake “reflects personal investment conviction,” as…
Crypto has been nearly perfectly correlated with a key software sector ETF, and that gauge…
Michael Saylor’s quiet hint this weekend put a spotlight on a methodical habit that has…