Bitcoin price extended its increase and surged above $18,000. BTC is gaining pace and might rise towards the $19,000 resistance zone.
Bitcoin extended its rise above the $17,500 and $18,000 resistance levels.
The price is trading above $18,000 and the 100 hourly simple moving average.
There is a key bullish trend line forming with support near $17,400 on the hourly chart of the BTC/USD pair (data feed from Kraken).
The pair could continue to move up towards the $19,000 resistance zone.
Bitcoin price gained pace after there was a close above the $17,000 pivot zone. BTC accelerated higher above the $17,250 resistance zone to move into a positive zone, similar to ethereum.
The price climbed above the $17,500 resistance zone to start a strong increase. The bulls even pumped the price above the $18,000 resistance zone. A high was formed near $18,367 and the price is now consolidating gains.
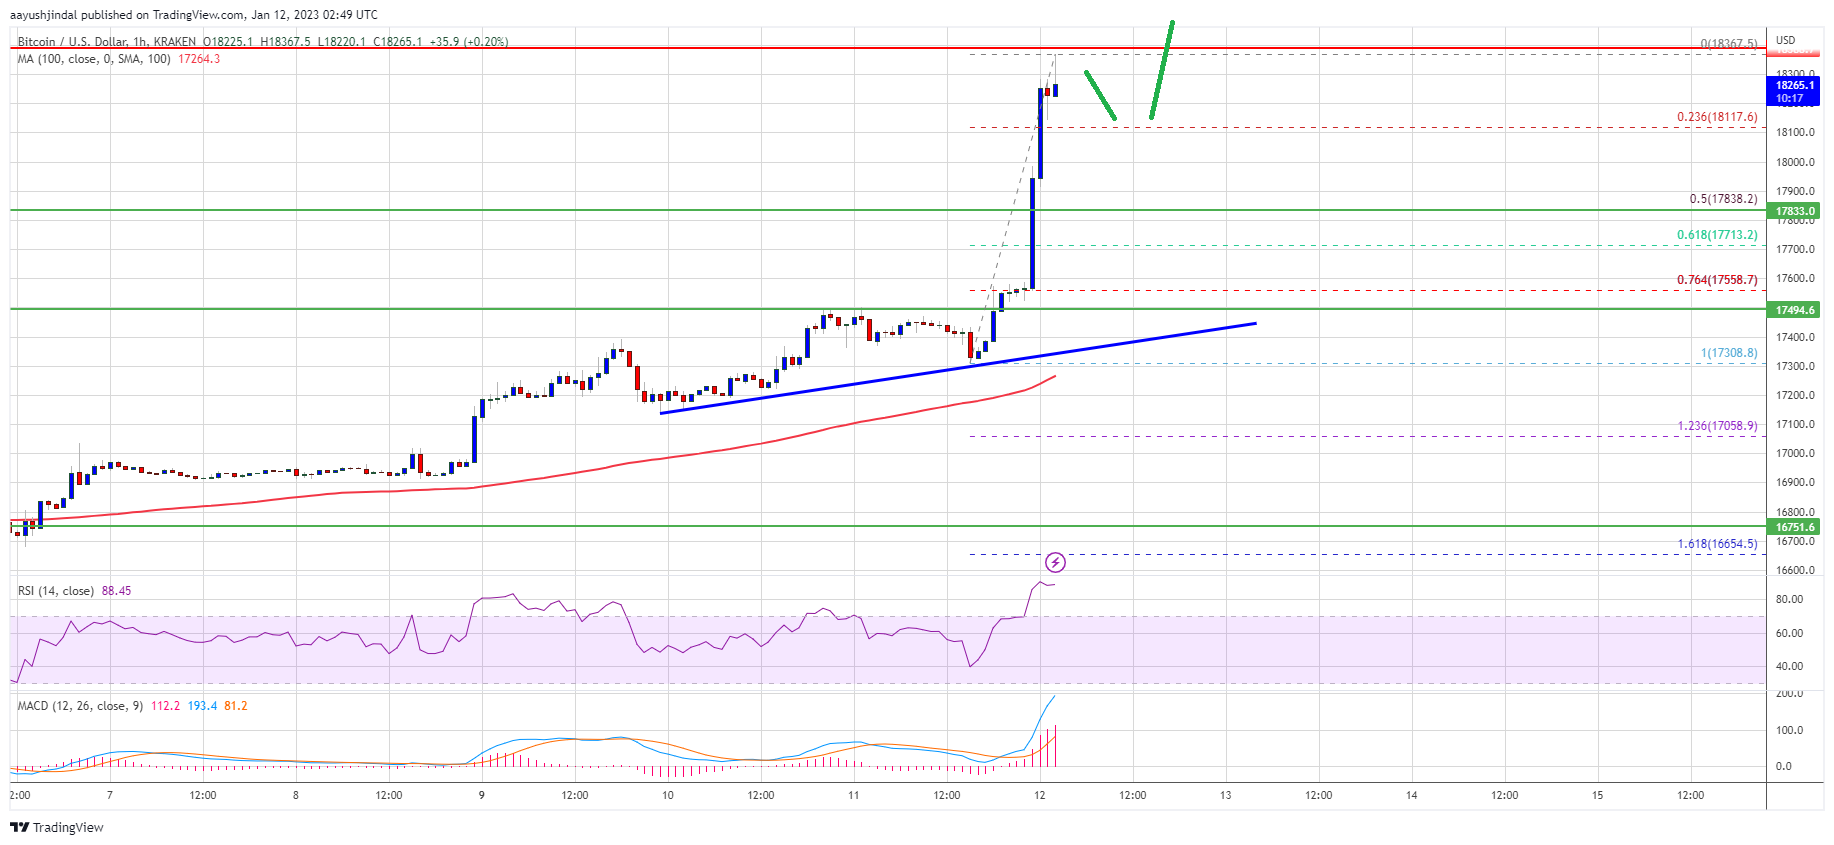
Bitcoin price is trading above $18,000 and the 100 hourly simple moving average. There is also a key bullish trend line forming with support near $17,400 on the hourly chart of the BTC/USD pair. It is also well above the 23.6% Fib retracement level of the recent surge from the $17,308 swing low to $18,367 high.
Source: BTCUSD on TradingView.com
On the upside, an immediate resistance is near the $18,350 level. The next major resistance is near the $18,500 zone, above which the price might continue to move up. In the stated case, the price may perhaps rise towards the $19,200 level. Any more gains might send btc price towards the $20,000 level.
If bitcoin price fails to clear the $18,350 resistance, it could start a downside correction. An immediate support on the downside is near the $18,120 level.
The next major support is near the $17,800 level. It is near the 50% Fib retracement level of the recent surge from the $17,308 swing low to $18,367 high. The main support is now forming near the $17,400 level and the trend line, below which the price might retest $17,000.
Technical indicators:
Hourly MACD – The MACD is now gaining pace in the bullish zone.
Hourly RSI (Relative Strength Index) – The RSI for BTC/USD is now above the 50 level.
Major Support Levels – $18,120, followed by $17,800.
Major Resistance Levels – $18,350, $18,500 and $19,200.
Bitcoin price extended its increase and surged above $18,000. BTC is gaining pace and might rise towards the $19,000 resistance zone.
Bitcoin extended its rise above the $17,500 and $18,000 resistance levels.
The price is trading above $18,000 and the 100 hourly simple moving average.
There is a key bullish trend line forming with support near $17,400 on the hourly chart of the BTC/USD pair (data feed from Kraken).
The pair could continue to move up towards the $19,000 resistance zone.
Bitcoin price gained pace after there was a close above the $17,000 pivot zone. BTC accelerated higher above the $17,250 resistance zone to move into a positive zone, similar to ethereum.
The price climbed above the $17,500 resistance zone to start a strong increase. The bulls even pumped the price above the $18,000 resistance zone. A high was formed near $18,367 and the price is now consolidating gains.
Bitcoin price is trading above $18,000 and the 100 hourly simple moving average. There is also a key bullish trend line forming with support near $17,400 on the hourly chart of the BTC/USD pair. It is also well above the 23.6% Fib retracement level of the recent surge from the $17,308 swing low to $18,367 high.
Source: BTCUSD on TradingView.com
On the upside, an immediate resistance is near the $18,350 level. The next major resistance is near the $18,500 zone, above which the price might continue to move up. In the stated case, the price may perhaps rise towards the $19,200 level. Any more gains might send btc price towards the $20,000 level.
If bitcoin price fails to clear the $18,350 resistance, it could start a downside correction. An immediate support on the downside is near the $18,120 level.
The next major support is near the $17,800 level. It is near the 50% Fib retracement level of the recent surge from the $17,308 swing low to $18,367 high. The main support is now forming near the $17,400 level and the trend line, below which the price might retest $17,000.
Technical indicators:
Hourly MACD – The MACD is now gaining pace in the bullish zone.
Hourly RSI (Relative Strength Index) – The RSI for BTC/USD is now above the 50 level.
Major Support Levels – $18,120, followed by $17,800.
Major Resistance Levels – $18,350, $18,500 and $19,200.
Tags: bitcoinbitcoin pricebtcusdBTCUSDTxbtusd
NewsBTCRead More
The current consolidation of Bitcoin is showing signs of a deeper shift rather than a…
Blockstream CEO, Adam Back, denied on Wednesday that he is Satoshi Nakamoto, the pseudonymous creator…
Bitcoin Magazine Nunchuk Releases Open-Source Tools for Bitcoin Agents With Bounded Authority Nunchuk has released…
Speaking at a Mizuho event, the Strategy (MSTR) executive chairman said the formation of banking…
Dogecoin’s value could see massive gains if the leading crypto were to reach Bitcoin and…
Also: North Korea’s 6-month plot with Drift, Solana Foundation’s new ad and Alchemy AI.Read MoreCoinDesk:…