Bitcoin price extended its rally above the $43,200 resistance. BTC is now consolidating gains and might rally further toward the $45,000 zone.
Bitcoin surged further above the $42,200 and $43,200 levels.
The price is trading above $43,200 and the 100 hourly Simple moving average.
There are two bullish trend lines forming with support near $43,200 and $41,800 on the hourly chart of the BTC/USD pair (data feed from Kraken).
The pair could correct lower toward $43,200 before it starts a fresh increase.
Bitcoin price remained in a steady uptrend above the $40,000 resistance zone. BTC gained over 15% in the past few days and even surged above the $42,000 zone.
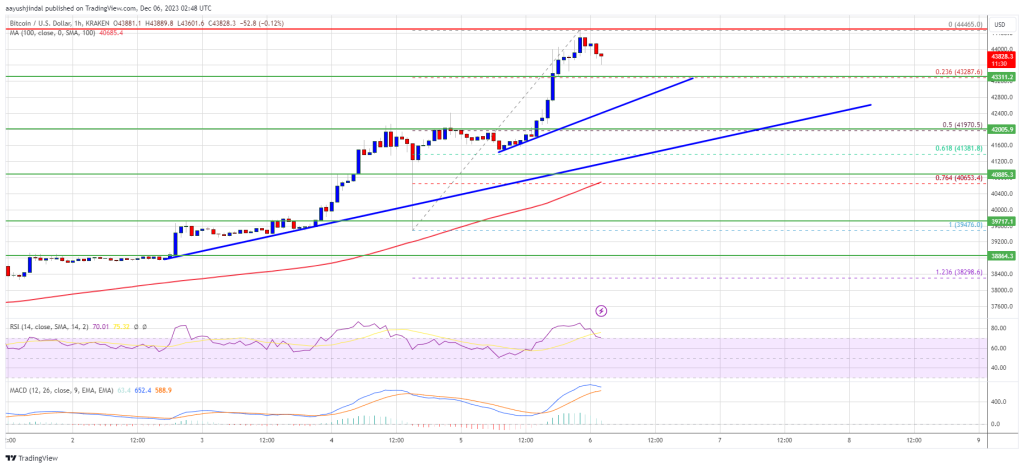
The upward move gained pace above the $43,200 resistance zone. A new multi-month high is formed near $44,465 and the price is now correcting gains. There was a move below the $44,000 level. The price is still above the 23.6% Fib retracement level of the upward move from the $39,476 swing low to the $44,465 high.
Bitcoin also trades above $43,200 and the 100 hourly Simple moving average. Besides, there are two bullish trend lines forming with support near $43,200 and $41,800 on the hourly chart of the BTC/USD pair. The second trend line is close to the 50% Fib retracement level of the upward move from the $39,476 swing low to the $44,465 high.
On the upside, immediate resistance is near the $44,200 level. The first major resistance is forming near $44,450, above which the price might rise toward the $45,000 level.
Source: BTCUSD on TradingView.com
A close above the $45,000 resistance might send the price further higher. The next key resistance could be near $46,400, above which BTC could rise toward the $48,000 level.
If Bitcoin fails to rise above the $44,500 resistance zone, it could start a downside correction. Immediate support on the downside is near the $43,250 level.
The next major support is near $42,800, below which the price might test the second trend line. If there is a move below $42,000, there is a risk of more downsides. In the stated case, the price could drop toward the $40,500 support in the near term.
Technical indicators:
Hourly MACD – The MACD is now gaining pace in the bullish zone.
Hourly RSI (Relative Strength Index) – The RSI for BTC/USD is now above the 50 level.
Major Support Levels – $43,200, followed by $42,000.
Major Resistance Levels – $44,200, $44,450, and $45,000.
[#item_full_content]NewsBTCRead MoreBitcoin is attempting to reclaim the $70,000 level after weeks of volatility. Yet repeated failures…
What to Know: Bitcoin faces significant downward pressure, with analysts targeting the $55,000–$58,000 range due…
The founder of CryptoQuant has explained that Bitcoin is not “pumpable” right now based on…
Bitcoin price started a recovery wave above $68,500. BTC is now struggling to clear $72,000…
Bitcoin’s latest drawdown from its all-time high is being compared to 2022 across crypto Twitter…
Scaramucci noted that SkyBridge has been purchasing bitcoin at various price points, including around $84,000,…