Bitcoin price started a major increase above $91,200. BTC is now showing bullish signs and might extend gains above $93,000.
Bitcoin started a fresh increase above the $91,200 zone.
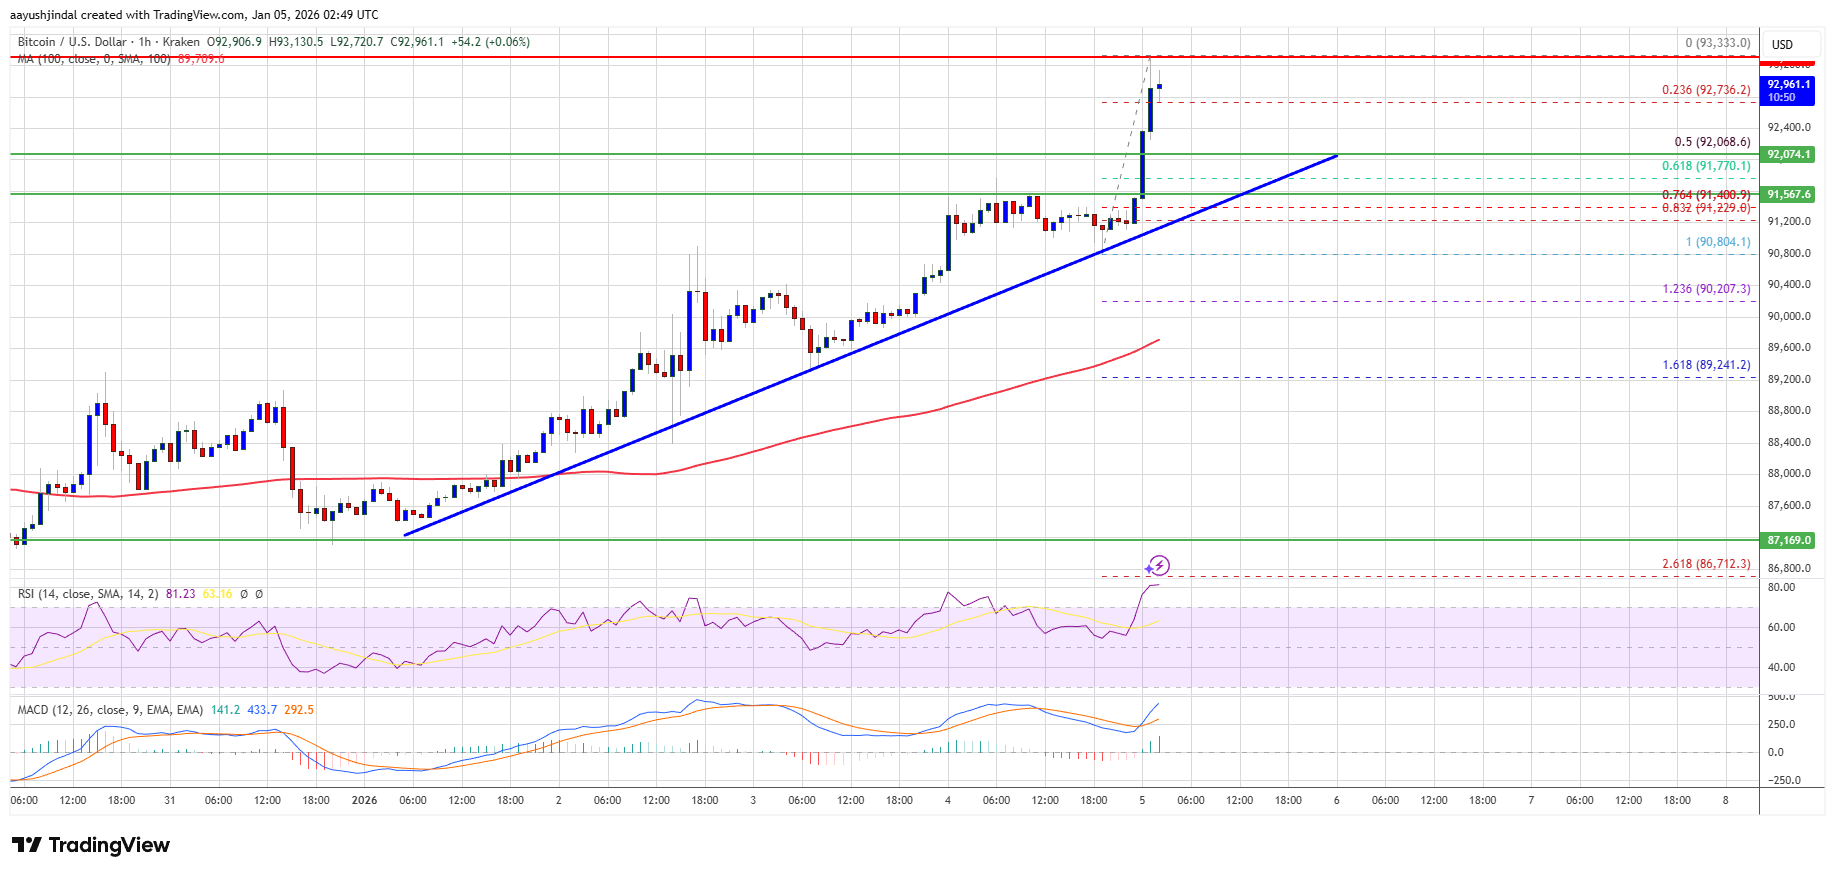
The price is trading above $92,000 and the 100 hourly Simple moving average.
There is a key bullish trend line forming with support at $91,500 on the hourly chart of the BTC/USD pair (data feed from Kraken).
The pair might continue to move up if it stays above the $91,200 zone.
Bitcoin price remained supported above the $90,000 zone and started a fresh increase. BTC gained pace for a move above the $90,500 and $91,200 resistance levels.
It even surpassed $92,000. A new multi-week high was formed at $93,333 and the price is now consolidating gains. It is stable above the 23.6% Fib retracement level of the recent upward move from the $90,804 swing low to the $93,333 high.
Bitcoin is now trading above $92,000 and the 100 hourly Simple moving average. Besides, there is a key bullish trend line forming with support at $91,500 on the hourly chart of the BTC/USD pair.
If the price remains stable above $91,500, it could attempt a fresh recovery wave. Immediate resistance is near the $93,200 level. The first key resistance is near the $93,500 level. The next resistance could be $94,000. A close above the $94,000 resistance might send the price further higher.
In the stated case, the price could rise and test the $94,650 resistance. Any more gains might send the price toward the $95,000 level. The next barrier for the bulls could be $95,500 and $95,800.
If Bitcoin fails to rise above the $93,200 resistance zone, it could start another decline. Immediate support is near the $92,200 level. The first major support is near the $92,000 level or the 50% Fib retracement level of the recent upward move from the $90,804 swing low to the $93,333 high.
The next support is now near the $91,500 zone. Any more losses might send the price toward the $90,500 support in the near term. The main support sits at $90,000, below which BTC might accelerate lower in the near term.
Technical indicators:
Hourly MACD – The MACD is now gaining pace in the bullish zone.
Hourly RSI (Relative Strength Index) – The RSI for BTC/USD is now above the 50 level.
Major Support Levels – $92,000, followed by $91,500.
Major Resistance Levels – $93,200 and $94,000.
[#item_full_content]NewsBTCRead MoreThe Ethereum treasury company added nearly 10,000 ETH while expanding its stock buyback, citing ether…
The put/call ratio has fallen to about 0.52 from 0.76 in late June, and one-week…
The vast majority of the activity was concentrated in BlackRock’s IBIT product accounting for nearly…
Your day-ahead look for July 27, 2026Read MoreCoinDesk: Bitcoin, Ethereum, Crypto News and Price Data[#item_full_content]
CoinEx's Jeff Ko sees bitcoin staying range-bound near $65,000 while retreating oil, a 4.7% 10-year…
ETH outperforms BTC, hinting at potential altcoin rally, as the U.S. and Iran hold fire…