Bitcoin price is struggling to clear the $52,000 resistance. BTC could start a decent downside correction if it breaks the $50,500 support zone.
Bitcoin price is still struggling to clear the $52,000 resistance zone.
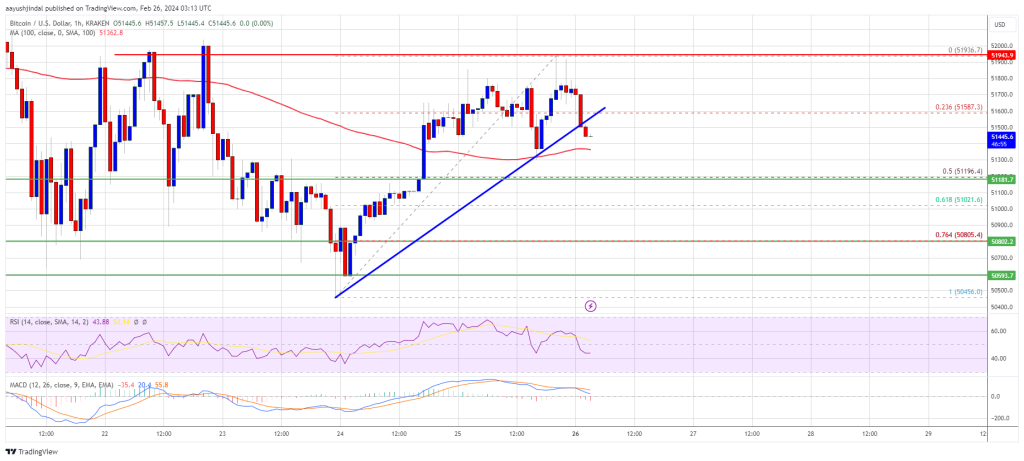
The price is trading below $51,600 and the 100 hourly Simple moving average.
There was a break below a connecting bullish trend line with support at $51,500 on the hourly chart of the BTC/USD pair (data feed from Kraken).
The pair could extend its current decline and revisit the $50,500 support.
Bitcoin price retested the $50,500 support zone and even spiked toward $50,400. However, the bulls were active near the $50,450. A low was formed at $50,456 and the price recovered above $51,200.
The bears are now protecting an upside break above the $52,000 resistance zone. A high is formed at $51,936 and the price is now moving lower. There was a break below a connecting bullish trend line with support at $51,500 on the hourly chart of the BTC/USD pair.
There was a break below the 23.6% Fib retracement level of the upward move from the $50,456 swing low to the $51,936 high. Bitcoin is now trading below $51,600 and the 100 hourly Simple moving average.
Source: BTCUSD on TradingView.com
Immediate resistance is near the $51,600 level. The next key resistance could be $52,000, above which the price could rise toward the $52,500 resistance zone. The main resistance is now near the $53,000 level. A clear move above the $53,000 resistance could send the price toward the $53,500 resistance. The next resistance could be near the $54,200 level.
If Bitcoin fails to rise above the $51,600 resistance zone, it could start another decline in the near term. Immediate support on the downside is near the $51,300 level and the 100 hourly SMA.
The first major support is $51,100 or the 50% Fib retracement level of the upward move from the $50,456 swing low to the $51,936 high. If there is a close below $51,100, the price could start a decent pullback. In the stated case, the price could decline toward the $50,500 support zone, below which the price might even test $50,000.
Technical indicators:
Hourly MACD – The MACD is now gaining pace in the bearish zone.
Hourly RSI (Relative Strength Index) – The RSI for BTC/USD is now below the 50 level.
Major Support Levels – $51,100, followed by $50,500.
Major Resistance Levels – $51,600, $51,800, and $52,000.
[#item_full_content]NewsBTCRead MoreRipple CTO Emeritus David Schwartz has clarified a long-running point of confusion in the XRP…
Bitcoin Magazine Billionaire Investor Jeremy Grantham: Bitcoin Will ‘Dwindle Away With a Whimper’ Legendary investor…
TL;DR Bitcoin fell below the $59,000 threshold as macro pressure returned to crypto markets. The…
TL;DR Bitcoin options positioning has shifted toward downside protection, according to Deribit and Block Scholes…
TL;DR Oman has launched Omanhash.om, a state-supervised national Bitcoin mining pool. The pool is described…
Bitcoin Magazine ‘I See Volatility as Opportunity’: Bitcoin Tests Critical Support as Key Level Hangs…