Bitcoin price struggled to continue higher above the $43,800 resistance. BTC is moving lower and might decline heavily if it breaks the $41,800 support.
Bitcoin price is declining from the $43,800 resistance zone.
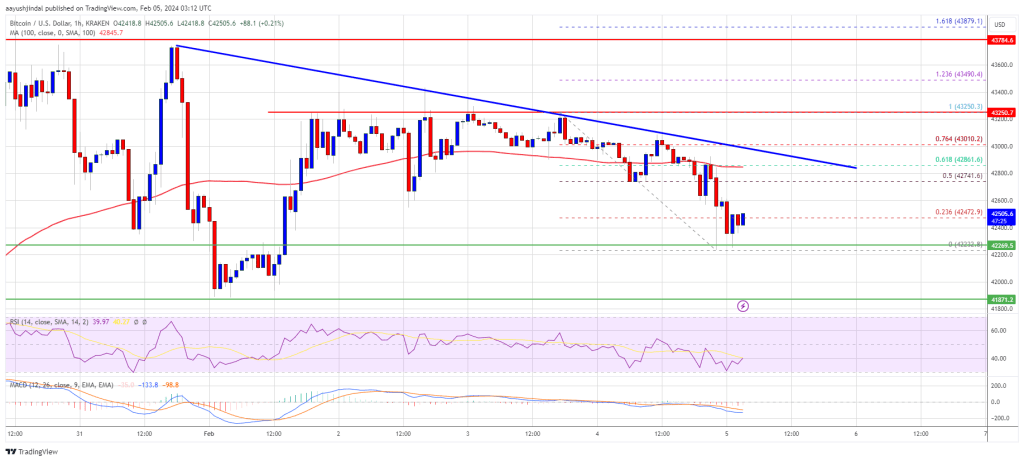
The price is trading below $42,800 and the 100 hourly Simple moving average.
There is a key bearish trend line forming with resistance near $42,850 on the hourly chart of the BTC/USD pair (data feed from Kraken).
The pair could continue to decline if there is a clear move below the $41,800 support.
Bitcoin price made another attempt to gain pace above the $43,000 and $43,200 resistance levels. However, BTC struggled to extend its gains and recently started another decline below $42,800.
There was a move below the $42,500 support. A low is formed near $42,232 and the price is now consolidating losses. There is also a key bearish trend line forming with resistance near $42,850 on the hourly chart of the BTC/USD pair.
Bitcoin is now trading below $42,800 and the 100 hourly Simple moving average. Immediate resistance is near the $42,750 level. It is near the 50% Fib retracement level of the downward wave from the $43,250 swing high to the $42,232 low.
The next key resistance could be $42,850 and the trend line. The trend line is close to the 61.8% Fib retracement level of the downward wave from the $43,250 swing high to the $42,232 low, above which the price could start a decent increase.
Source: BTCUSD on TradingView.com
The next stop for the bulls may perhaps be $43,250. A clear move above the $43,250 resistance could send the price toward the $43,800 resistance. The next resistance is now forming near the $44,200 level. A close above the $44,200 level could push the price further higher. The next major resistance sits at $45,000.
If Bitcoin fails to rise above the $42,850 resistance zone, it could start another decline. Immediate support on the downside is near the $42,250 level.
The first major support is $41,800. If there is a close below $41,800, the price could gain bearish momentum. In the stated case, the price could dive toward the $40,500 support.
Technical indicators:
Hourly MACD – The MACD is now gaining pace in the bearish zone.
Hourly RSI (Relative Strength Index) – The RSI for BTC/USD is now below the 50 level.
Major Support Levels – $42,250, followed by $41,800.
Major Resistance Levels – $42,750, $42,850, and $43,250.
[#item_full_content]NewsBTCRead MoreBitcoin price started a sharp decline from well above $73,000. BTC is now consolidating and…
Data shows the Bitcoin Coinbase Premium Gap has been positive for the past 25 days,…
Bitcoin Magazine North Carolina Lawmakers Propose State Bitcoin Reserve North Carolina lawmakers introduced legislation on…
The Coinbase Bitcoin Yield Fund's tokenized share class runs on Base as the $3.5 trillion…
Bitcoin Magazine Adam Back Confirmed As A Bitcoin 2026 Speaker Adam Back has been officially…
Arthur Hayes, co-founder of BitMEX, has reiterated his $250,000 year-end price target for Bitcoin. With…