Bitcoin price failed to clear the $17,300 zone and corrected lower. BTC could find a strong buying interest near $16,900 or $16,700 in the coming sessions.
Bitcoin failed to gain pace for a move above $17,300 and $17,450.
The price is trading below $17,000 and the 100 hourly simple moving average.
There is a key bearish trend line forming with resistance near $17,150 on the hourly chart of the BTC/USD pair (data feed from Kraken).
The pair could bounce back if it stays above the $16,900 and $16,700 support levels.
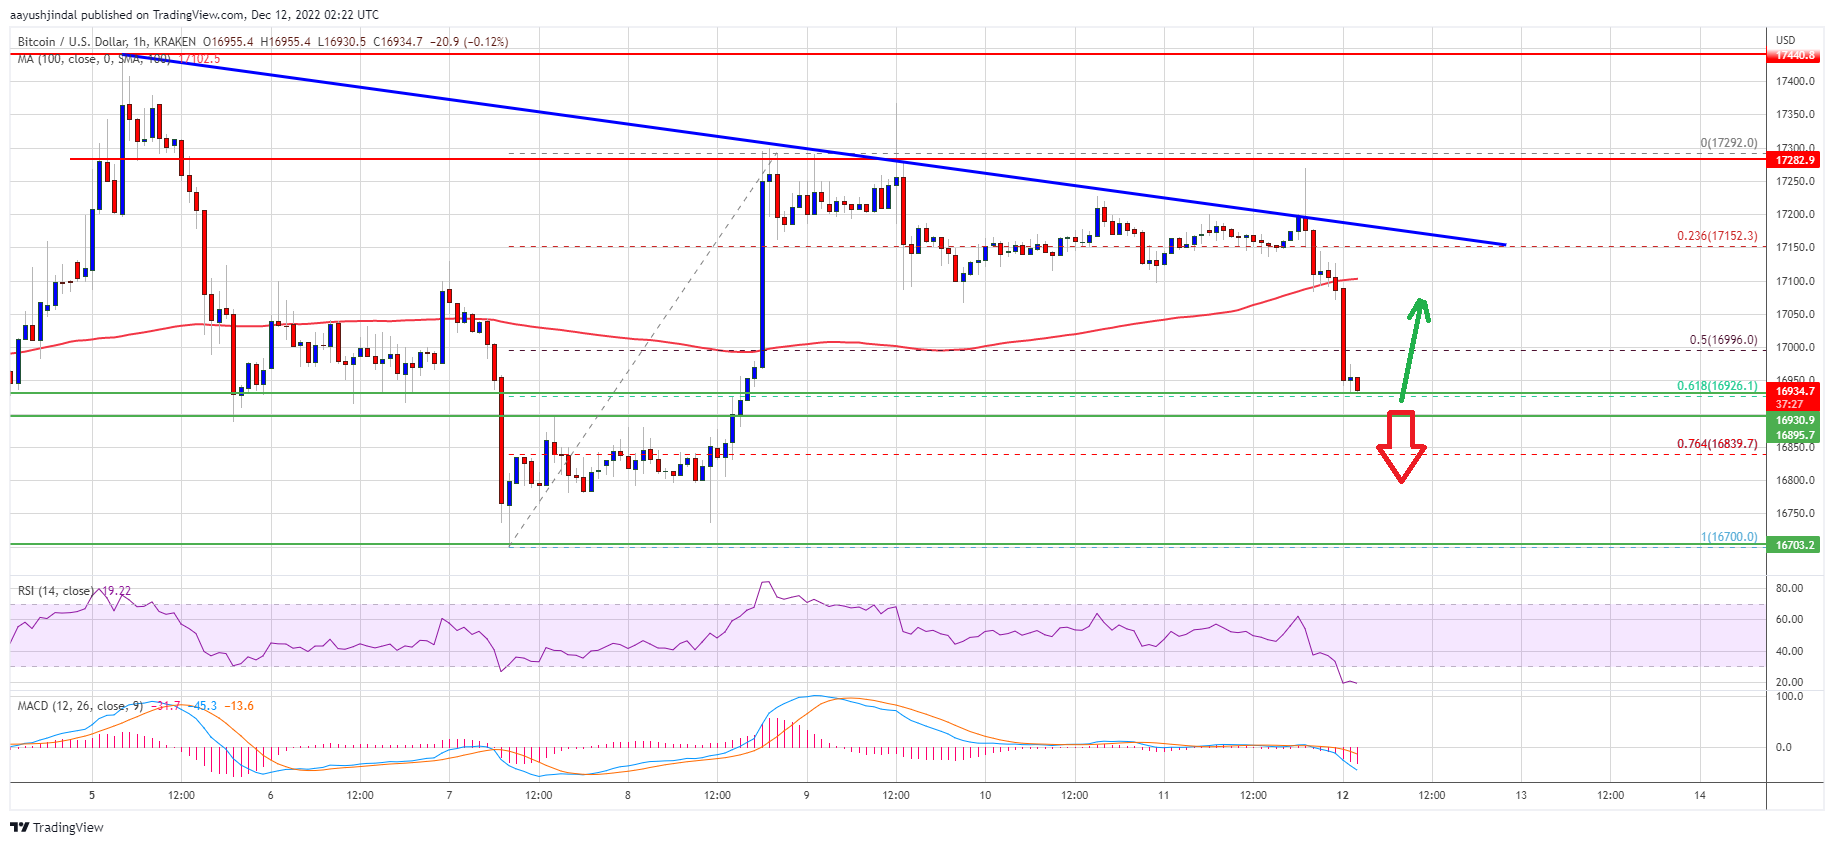
Bitcoin price was able to clear the $17,000 resistance zone. However, the price failed to gain pace for a move above $17,300 and $17,450. A high was formed near $17,292 and the price started a fresh decline.
There was a clear move below the $17,100 and $17,000 levels. The price declined below the 50% Fib retracement level of the upward move from the $16,700 swing low to $17,292 high. Bitcoin price is now trading below $17,000 and the 100 hourly simple moving average.
There is also a key bearish trend line forming with resistance near $17,150 on the hourly chart of the BTC/USD pair. The pair is now approaching the 61.8% Fib retracement level of the upward move from the $16,700 swing low to $17,292 high.
On the upside, an immediate resistance is near the $17,050 level. The first major resistance is near the $17,150 zone and the trend line, above which the price may perhaps start a fresh increase.
Source: BTCUSD on TradingView.com
In the stated case, the price could rise towards the $17,300 resistance. The next major resistance is near $17,450, above which the price rise towards the $18,000 zone in the near term.
If bitcoin fails to clear the $17,150 resistance, there could be more losses. An immediate support on the downside is near the $16,900 level.
The next major support is near the $16,700 zone or the last swing low. A downside break below the $16,700 support might call a drop towards $16,500. Any more losses might push the price towards the $16,200 zone in the near term.
Technical indicators:
Hourly MACD – The MACD is now gaining pace in the bearish zone.
Hourly RSI (Relative Strength Index) – The RSI for BTC/USD is now in the oversold zone.
Major Support Levels – $16,900, followed by $16,700.
Major Resistance Levels – $17,050, $17,150 and $17,450.
Bitcoin price failed to clear the $17,300 zone and corrected lower. BTC could find a strong buying interest near $16,900 or $16,700 in the coming sessions.
Bitcoin failed to gain pace for a move above $17,300 and $17,450.
The price is trading below $17,000 and the 100 hourly simple moving average.
There is a key bearish trend line forming with resistance near $17,150 on the hourly chart of the BTC/USD pair (data feed from Kraken).
The pair could bounce back if it stays above the $16,900 and $16,700 support levels.
Bitcoin price was able to clear the $17,000 resistance zone. However, the price failed to gain pace for a move above $17,300 and $17,450. A high was formed near $17,292 and the price started a fresh decline.
There was a clear move below the $17,100 and $17,000 levels. The price declined below the 50% Fib retracement level of the upward move from the $16,700 swing low to $17,292 high. Bitcoin price is now trading below $17,000 and the 100 hourly simple moving average.
There is also a key bearish trend line forming with resistance near $17,150 on the hourly chart of the BTC/USD pair. The pair is now approaching the 61.8% Fib retracement level of the upward move from the $16,700 swing low to $17,292 high.
On the upside, an immediate resistance is near the $17,050 level. The first major resistance is near the $17,150 zone and the trend line, above which the price may perhaps start a fresh increase.
Source: BTCUSD on TradingView.com
In the stated case, the price could rise towards the $17,300 resistance. The next major resistance is near $17,450, above which the price rise towards the $18,000 zone in the near term.
If bitcoin fails to clear the $17,150 resistance, there could be more losses. An immediate support on the downside is near the $16,900 level.
The next major support is near the $16,700 zone or the last swing low. A downside break below the $16,700 support might call a drop towards $16,500. Any more losses might push the price towards the $16,200 zone in the near term.
Technical indicators:
Hourly MACD – The MACD is now gaining pace in the bearish zone.
Hourly RSI (Relative Strength Index) – The RSI for BTC/USD is now in the oversold zone.
Major Support Levels – $16,900, followed by $16,700.
Major Resistance Levels – $17,050, $17,150 and $17,450.
Tags: bitcoinbitcoin pricebtcusdBTCUSDTxbtusd
NewsBTCRead More
Bitcoin Magazine Bitcoin Exchange Inflows Spike to 49,000 BTC in a Day, Signaling More Volatility…
Bitcoin Magazine Wavespace Launches MiCA-Compliant Self-Custodial Bitcoin Debit Card Powered by Lightning and NWC Wavespace,…
For readers tracking where the market is actually changing, this is the part that matters.…
The headline number is useful, but the real story is what it says about positioning.…
Miners must redirect their hashrate before the July 31 cutoff, as the pool will stop…
The Nasdaq-listed Korean media company once lined up $1 billion in financing to buy 10,000…