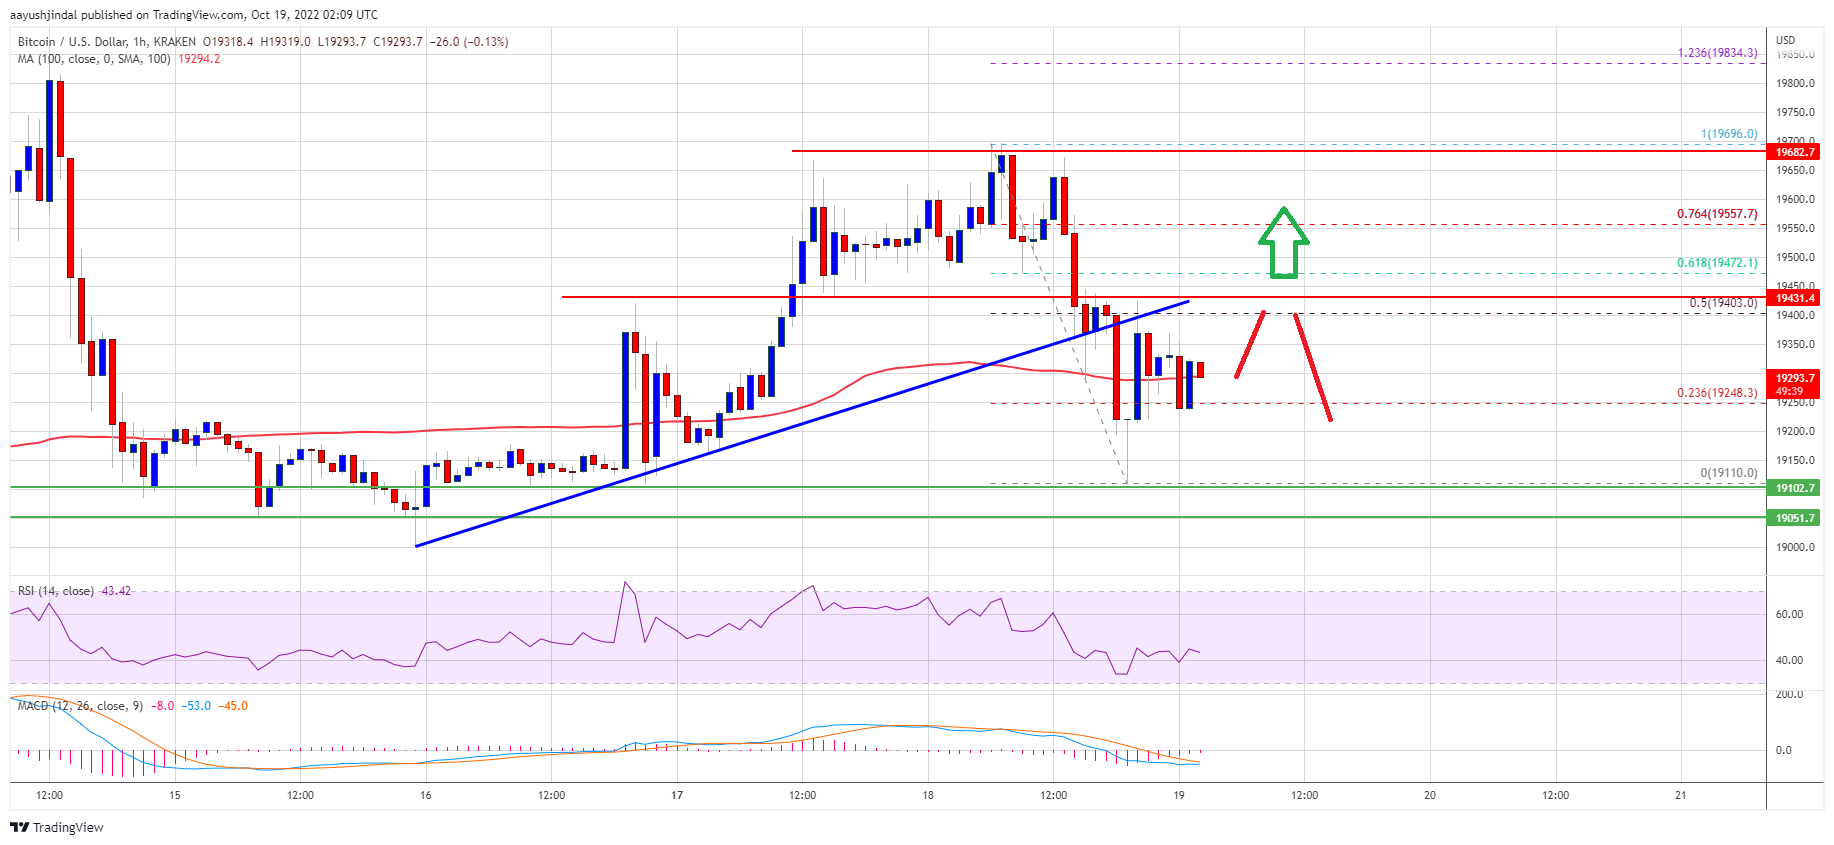
Bitcoin price corrected lower below the $19,500 level against the US Dollar. BTC remains in a key range and trading above the $19,000 support zone.
Bitcoin failed to gain strength above $19,600 and corrected gains.
The price is trading near $19,250 and the 100 hourly simple moving average.
There was a break below a key bullish trend line with support near $19,400 on the hourly chart of the BTC/USD pair (data feed from Kraken).
The pair could attempt a fresh increase unless there is a clear move below the $19,000 support.
Bitcoin Price Remains Supported
Bitcoin price made an attempt to gain pace above the $19,500 resistance zone. BTC even spiked above the $19,600 level, but there was no follow through move.
The price formed a high near $19,696 and started a downside correction. There was a move below the $19,500 and $19,400 levels. Besides, there was a break below a key bullish trend line with support near $19,400 on the hourly chart of the BTC/USD pair.
Bitcoin price traded as low as $19,110 and is currently trading in a range. It is trading near $19,250 and the 100 hourly simple moving average. There was a break above the 23.6% Fib retracement level of the recent decline from the $19,696 swing high to $19,110 low.
On the upside, an immediate resistance is near the $19,400 level. It is close to the 50% Fib retracement level of the recent decline from the $19,696 swing high to $19,110 low.
Source: BTCUSD on TradingView.com
The first major resistance sits near the $19,680 level. A clear move above the $19,680 resistance might start a decent increase. In the stated case, the price may perhaps test the $20,000 resistance. Any more gains might start a steady increase towards the $21,200 resistance zone.
Downside Break in BTC?
If bitcoin fails to rise above the $19,400 resistance zone, it could continue to move down. An immediate support on the downside is near the $19,100 zone.
The next major support is near the $19,000 zone. A downside break and close below the $19,000 support zone might start a major decline. In the stated case, the price could decline towards the $18,500 support zone.
Technical indicators:
Hourly MACD – The MACD is now losing pace in the bearish zone.
Hourly RSI (Relative Strength Index) – The RSI for BTC/USD is now below the 50 level.
Major Support Levels – $19,100, followed by $19,000.
Major Resistance Levels – $19,400, $19,680 and $20,000.
Bitcoin price corrected lower below the $19,500 level against the US Dollar. BTC remains in a key range and trading above the $19,000 support zone.
Bitcoin failed to gain strength above $19,600 and corrected gains.
The price is trading near $19,250 and the 100 hourly simple moving average.
There was a break below a key bullish trend line with support near $19,400 on the hourly chart of the BTC/USD pair (data feed from Kraken).
The pair could attempt a fresh increase unless there is a clear move below the $19,000 support.
Bitcoin price made an attempt to gain pace above the $19,500 resistance zone. BTC even spiked above the $19,600 level, but there was no follow through move.
The price formed a high near $19,696 and started a downside correction. There was a move below the $19,500 and $19,400 levels. Besides, there was a break below a key bullish trend line with support near $19,400 on the hourly chart of the BTC/USD pair.
Bitcoin price traded as low as $19,110 and is currently trading in a range. It is trading near $19,250 and the 100 hourly simple moving average. There was a break above the 23.6% Fib retracement level of the recent decline from the $19,696 swing high to $19,110 low.
On the upside, an immediate resistance is near the $19,400 level. It is close to the 50% Fib retracement level of the recent decline from the $19,696 swing high to $19,110 low.
Source: BTCUSD on TradingView.com
The first major resistance sits near the $19,680 level. A clear move above the $19,680 resistance might start a decent increase. In the stated case, the price may perhaps test the $20,000 resistance. Any more gains might start a steady increase towards the $21,200 resistance zone.
If bitcoin fails to rise above the $19,400 resistance zone, it could continue to move down. An immediate support on the downside is near the $19,100 zone.
The next major support is near the $19,000 zone. A downside break and close below the $19,000 support zone might start a major decline. In the stated case, the price could decline towards the $18,500 support zone.
Technical indicators:
Hourly MACD – The MACD is now losing pace in the bearish zone.
Hourly RSI (Relative Strength Index) – The RSI for BTC/USD is now below the 50 level.
Major Support Levels – $19,100, followed by $19,000.
Major Resistance Levels – $19,400, $19,680 and $20,000.
Tags: bitcoinbtcusdBTCUSDTxbtusd
NewsBTCRead More
BTC's relative weakness compared to stocks points to tepid spot demand, making the largest crypto…
Bitcoin Magazine Strategy’s Michael Saylor Met With Middle East Sovereign Wealth Funds to Pitch Bitcoin-Backed…
After breaking below $90,000 again, the next direction of the Bitcoin price is being hotly…
Bitcoin Magazine Bitcoin Coalition Pushes Back Against MSCI Proposal Targeting Bitcoin-Heavy Companies Bitcoin For Corporations…
Bitcoin Magazine Argentina Moves to Let Banks Offer Bitcoin and Crypto Services Argentina is considering…
Bitcoin Magazine Bitcoin Bulls Eye $94K Breakout Ahead of Crucial FOMC Rate Cut Decision Bitcoin…