Bitcoin price managed to stay above the $60,000 support. BTC recovered and is now facing hurdles near the $63,500 resistance zone.
Bitcoin seems to be trading in a range between $60,000 and $63,500.
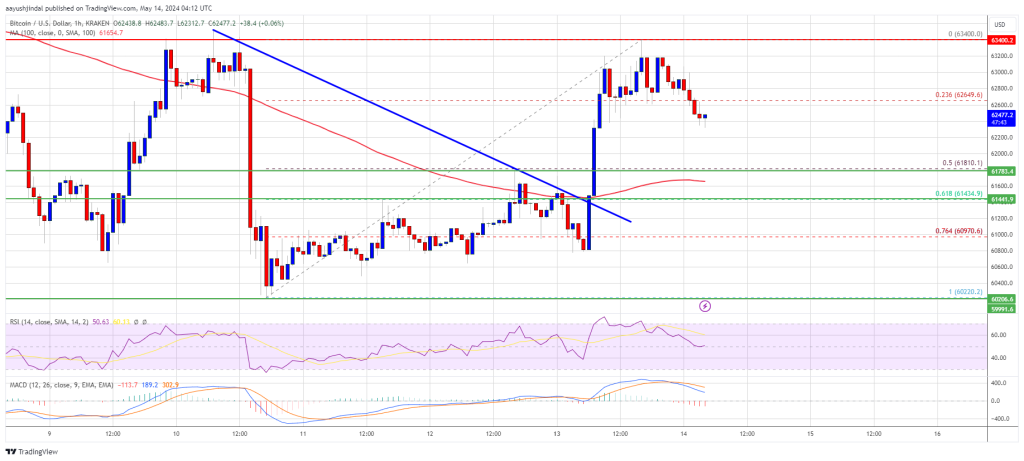
The price is trading above $61,800 and the 100 hourly Simple moving average.
There was a break above a major bearish trend line with resistance at $61,400 on the hourly chart of the BTC/USD pair (data feed from Kraken).
The pair could rally if it clears $63,500 or might revisit the range support at $60,000.
Bitcoin price extended its decline below the $60,800 support zone. However, the bulls were active above the $60,000 support zone. A low was formed at $60,220 and the price started a recovery wave.
There was a move above the $61,000 and $61,200 levels. Besides, there was a break above a major bearish trend line with resistance at $61,400 on the hourly chart of the BTC/USD pair. The pair rallied and revisited the main hurdle at $63,500.
A high was formed at $63,400 and the price is now consolidating gains. It traded below the 23.6% Fib retracement level of the upward move from the $60,220 swing low to the $63,400 high.
Bitcoin is still trading above $62,000 and the 100 hourly Simple moving average. Immediate resistance is near the $62,800 level. The first major resistance could be $63,000. The next key resistance could be $63,500. A clear move above the $63,200 resistance might send the price higher.
Source: BTCUSD on TradingView.com
The main resistance now sits at $63,500. If there is a close above the $63,500 resistance zone, the price could continue to move up. In the stated case, the price could rise toward $65,000.
If Bitcoin fails to climb above the $63,200 resistance zone, it could start another decline. Immediate support on the downside is near the $62,200 level.
The first major support is $61,800 or the 50% Fib retracement level of the upward move from the $60,220 swing low to the $63,400 high. If there is a close below $61,800, the price could start to drop toward $61,200. Any more losses might send the price toward the $60,250 support zone in the near term.
Technical indicators:
Hourly MACD – The MACD is now losing pace in the bullish zone.
Hourly RSI (Relative Strength Index) – The RSI for BTC/USD is now near the 50 level.
Major Support Levels – $61,800, followed by $61,200.
Major Resistance Levels – $63,200, $63,500, and $65,000.
[#item_full_content]NewsBTCRead MoreBessent said the U.S. Treasury Department will provide temporary authorization to allow countries to purchase…
Bitcoin Magazine Strategy (MSTR) Bought Over 4,000 Bitcoin Today via STRC As Strong Week Continues…
Bitcoin Magazine David Bailey Confirmed As A Bitcoin 2026 Speaker David Bailey has been officially…
Bitcoin Magazine Paraguay Adopts Stricter Crypto Oversight, Mandates Detailed Transaction on Bitcoin Reporting Paraguay’s National…
Bitcoin Magazine Policy Group Calls for Bitcoin Inclusion in Proposed Crypto Tax Exemption The Bitcoin…
Bitcoin Magazine Corporate Bitcoin Holdings Hit Record High as Institutions Accumulate 2.8x Mining Supply: Report…