Bitcoin price remained in a range above the $45,000 support. BTC failed to climb higher above the $48,000 resistance despite approval of spot ETF.
Bitcoin is still struggling to clear the $47,800 and $48,000 resistance levels.
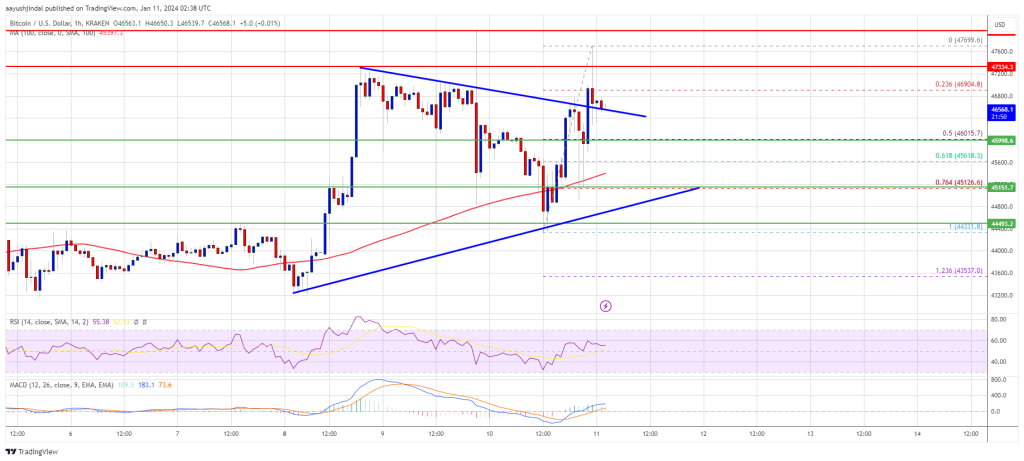
The price is trading above $45,600 and the 100 hourly Simple moving average.
There was a break above a major contracting triangle with resistance near $46,550 on the hourly chart of the BTC/USD pair (data feed from Kraken).
The pair could start a fresh decline if the bears continue to protect the $48,000 resistance.
Bitcoin price remained stable above the $45,500 resistance zone. Finally, the SEC approved all 11 spot ETF. BTC did climb higher above the $46,500 and $46,600 resistance levels after the news.
There was a break above a major contracting triangle with resistance near $46,550 on the hourly chart of the BTC/USD pair. However, the bears were still active near the $47,350 and $47,800 levels. A high was formed near $47,699 and the price is now showing a few bearish signs.
There was a minor decline below the $47,000 level. Bitcoin declined below the 23.6% Fib retracement level of the recent increase from the $44,333 swing low to the $47,699 high.
The price is now trading above $45,600 and the 100 hourly Simple moving average. On the upside, immediate resistance is near the $47,000 level. The first major resistance is $47,350. A clear move above the $47,350 resistance could send the price toward the $47,800 resistance.
Source: BTCUSD on TradingView.com
The next resistance is now forming near the $48,000 level. A close above the $48,000 level could send the price further higher. The next major resistance sits at $49,250.
If Bitcoin fails to rise above the $47,350 resistance zone, it could start a fresh decline. Immediate support on the downside is near the $46,550 level.
The next major support is $46,000 or the 50% Fib retracement level of the recent increase from the $44,333 swing low to the $47,699 high. If there is a move below $46,000, the price could gain bearish momentum. In the stated case, the price could drop toward the $45,150 support in the near term.
Technical indicators:
Hourly MACD – The MACD is now losing pace in the bullish zone.
Hourly RSI (Relative Strength Index) – The RSI for BTC/USD is now above the 50 level.
Major Support Levels – $46,500, followed by $46,000.
Major Resistance Levels – $47,000, $47,350, and $47,800.
[#item_full_content]NewsBTCRead MoreThe White House says it's still evaluating the "best structure" for the federal fund to…
Bitcoin Magazine Trump-Backed American Bitcoin (ABTC) Pushes Treasury Past 8,000 BTC American Bitcoin Corp (Nasdaq:…
Donald Trump’s scheduled keynote at the Bitcoin Conference in Nashville puts crypto policy back on…
Bitcoin Magazine USDT Returns to Bitcoin: RGB and UTEXO Enable Private Lightning Settlements Tether, the…
Bitcoin Magazine President Trump Signals Openness to Bitcoin in Trump Accounts, Calls Himself ‘a Big…
First, it was a tiny amount of bitcoin sales, then it was the purchase of…