Bitcoin price is attempting a recovery wave from the $16,000 support zone. BTC could start a decent increase if it clears the $17,000 and $17,200 resistance levels in the short term.
Bitcoin is slowly moving higher and consolidating above the $16,500 level.
The price is trading above $16,500 and the 100 hourly simple moving average.
There is a connecting bearish trend line forming with resistance near $16,900 on the hourly chart of the BTC/USD pair (data feed from Kraken).
The pair could start a recovery wave if it clears the $17,000 resistance zone.
Bitcoin price remained stable above the $16,000 support zone. BTC formed a base and slowly moved higher above the $16,350 resistance zone.
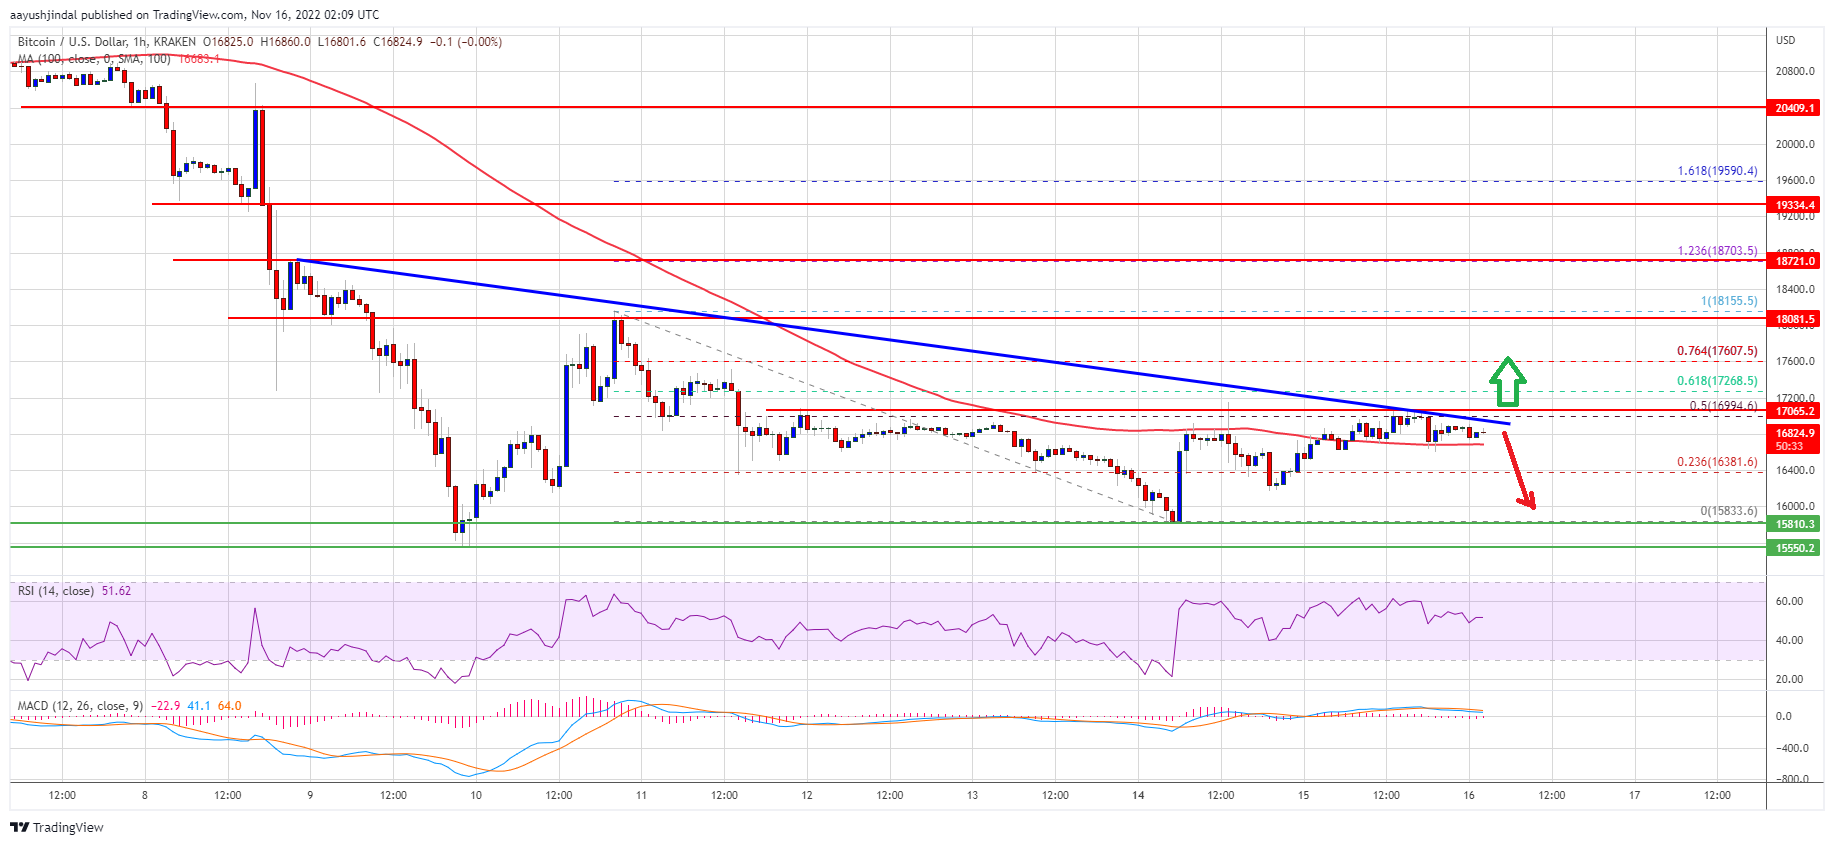
There was a move above the 23.6% Fib retracement level of the downward move from the $18,155 swing high to $15,833 low. The bulls were able to contain losses and the price started to move in a range above the $16,400 level.
Bitcoin price is now trading above $16,500 and the 100 hourly simple moving average, similar to ethereum. On the upside, an immediate resistance is near the $16,900 level. There is also a connecting bearish trend line forming with resistance near $16,900 on the hourly chart of the BTC/USD pair.
The trend line is near the 50% Fib retracement level of the downward move from the $18,155 swing high to $15,833 low. The first major resistance is near the $17,000 zone. A clear move above the $17,000 resistance might start a decent increase.
Source: BTCUSD on TradingView.com
The next major resistance is near $17,265, above which the price could test the $18,000 zone. Any more gains might send the price towards the $18,500 resistance zone.
If bitcoin fails to start a recovery wave above the $17,000 resistance zone, it could start a fresh decline. An immediate support on the downside is near the $16,650 level and the 100 hourly SMA.
The next major support is near the $16,350 zone. A clear move below the $16,350 support might push the price further lower. In this case, the price may perhaps decline towards the $16,000 support zone.
Technical indicators:
Hourly MACD – The MACD is now losing pace in the bullish zone.
Hourly RSI (Relative Strength Index) – The RSI for BTC/USD is now above the 50 level.
Major Support Levels – $16,350, followed by $16,000.
Major Resistance Levels – $16,900, $17,000 and $17,500.
Bitcoin price is attempting a recovery wave from the $16,000 support zone. BTC could start a decent increase if it clears the $17,000 and $17,200 resistance levels in the short term.
Bitcoin is slowly moving higher and consolidating above the $16,500 level.
The price is trading above $16,500 and the 100 hourly simple moving average.
There is a connecting bearish trend line forming with resistance near $16,900 on the hourly chart of the BTC/USD pair (data feed from Kraken).
The pair could start a recovery wave if it clears the $17,000 resistance zone.
Bitcoin price remained stable above the $16,000 support zone. BTC formed a base and slowly moved higher above the $16,350 resistance zone.
There was a move above the 23.6% Fib retracement level of the downward move from the $18,155 swing high to $15,833 low. The bulls were able to contain losses and the price started to move in a range above the $16,400 level.
Bitcoin price is now trading above $16,500 and the 100 hourly simple moving average, similar to ethereum. On the upside, an immediate resistance is near the $16,900 level. There is also a connecting bearish trend line forming with resistance near $16,900 on the hourly chart of the BTC/USD pair.
The trend line is near the 50% Fib retracement level of the downward move from the $18,155 swing high to $15,833 low. The first major resistance is near the $17,000 zone. A clear move above the $17,000 resistance might start a decent increase.
Source: BTCUSD on TradingView.com
The next major resistance is near $17,265, above which the price could test the $18,000 zone. Any more gains might send the price towards the $18,500 resistance zone.
If bitcoin fails to start a recovery wave above the $17,000 resistance zone, it could start a fresh decline. An immediate support on the downside is near the $16,650 level and the 100 hourly SMA.
The next major support is near the $16,350 zone. A clear move below the $16,350 support might push the price further lower. In this case, the price may perhaps decline towards the $16,000 support zone.
Technical indicators:
Hourly MACD – The MACD is now losing pace in the bullish zone.
Hourly RSI (Relative Strength Index) – The RSI for BTC/USD is now above the 50 level.
Major Support Levels – $16,350, followed by $16,000.
Major Resistance Levels – $16,900, $17,000 and $17,500.
Tags: bitcoinbtcusdBTCUSDTxbtusd
NewsBTCRead More
TL;DR Bitcoin recently rebounded from the $58,000 area and was validated near $60,326.78 in the…
For years, investors had valued the firm well above its bitcoin holdings, giving Strategy massive…
TL;DR CryptoQuant-linked data shows Bitcoin apparent demand remaining negative for 208 consecutive days. The metric…
Ripple's Brad Garlinghouse called Strategy's preferred-stock funding model "financial engineering" that distracted the market, pointing…
Bitcoin’s latest pullback was not driven by a single headline. Instead, traders were hit by…
Tokenized stock trading fueled fresh momentum across the Solana ecosystem, while Aave founder hinted at…