Bitcoin price is attempting a recovery wave from the $16,000 support zone. BTC could start a decent increase if it clears the $17,000 and $17,200 resistance levels in the short term.
Bitcoin is slowly moving higher and consolidating above the $16,500 level.
The price is trading above $16,500 and the 100 hourly simple moving average.
There is a connecting bearish trend line forming with resistance near $16,900 on the hourly chart of the BTC/USD pair (data feed from Kraken).
The pair could start a recovery wave if it clears the $17,000 resistance zone.
Bitcoin price remained stable above the $16,000 support zone. BTC formed a base and slowly moved higher above the $16,350 resistance zone.
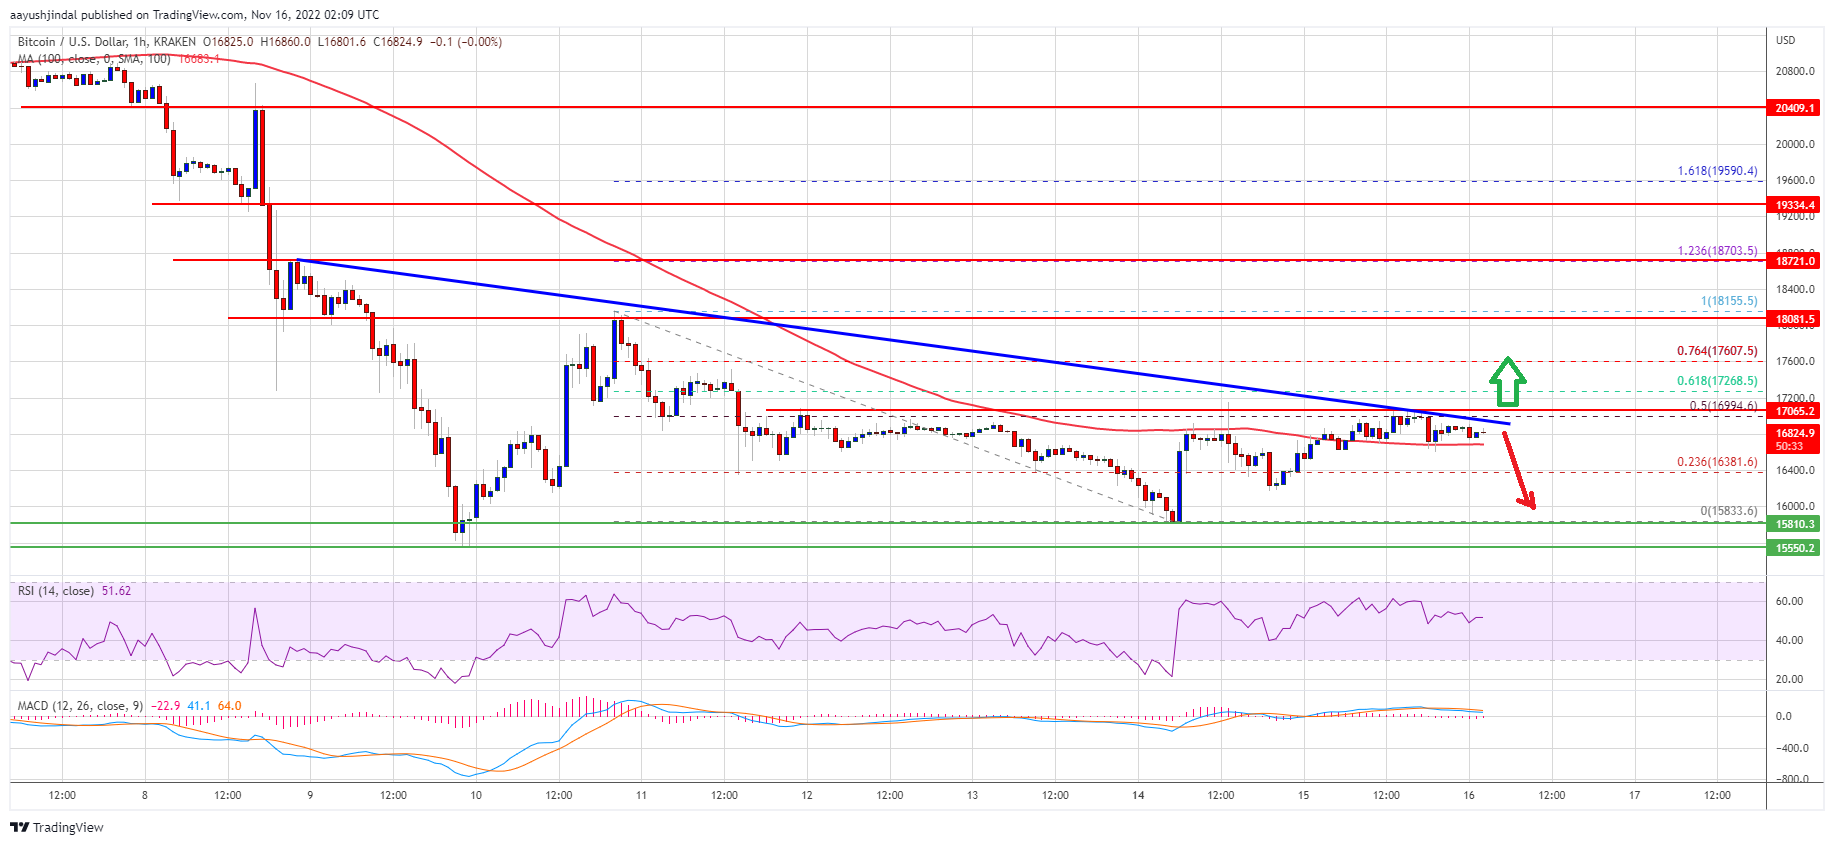
There was a move above the 23.6% Fib retracement level of the downward move from the $18,155 swing high to $15,833 low. The bulls were able to contain losses and the price started to move in a range above the $16,400 level.
Bitcoin price is now trading above $16,500 and the 100 hourly simple moving average, similar to ethereum. On the upside, an immediate resistance is near the $16,900 level. There is also a connecting bearish trend line forming with resistance near $16,900 on the hourly chart of the BTC/USD pair.
The trend line is near the 50% Fib retracement level of the downward move from the $18,155 swing high to $15,833 low. The first major resistance is near the $17,000 zone. A clear move above the $17,000 resistance might start a decent increase.
Source: BTCUSD on TradingView.com
The next major resistance is near $17,265, above which the price could test the $18,000 zone. Any more gains might send the price towards the $18,500 resistance zone.
If bitcoin fails to start a recovery wave above the $17,000 resistance zone, it could start a fresh decline. An immediate support on the downside is near the $16,650 level and the 100 hourly SMA.
The next major support is near the $16,350 zone. A clear move below the $16,350 support might push the price further lower. In this case, the price may perhaps decline towards the $16,000 support zone.
Technical indicators:
Hourly MACD – The MACD is now losing pace in the bullish zone.
Hourly RSI (Relative Strength Index) – The RSI for BTC/USD is now above the 50 level.
Major Support Levels – $16,350, followed by $16,000.
Major Resistance Levels – $16,900, $17,000 and $17,500.
Bitcoin price is attempting a recovery wave from the $16,000 support zone. BTC could start a decent increase if it clears the $17,000 and $17,200 resistance levels in the short term.
Bitcoin is slowly moving higher and consolidating above the $16,500 level.
The price is trading above $16,500 and the 100 hourly simple moving average.
There is a connecting bearish trend line forming with resistance near $16,900 on the hourly chart of the BTC/USD pair (data feed from Kraken).
The pair could start a recovery wave if it clears the $17,000 resistance zone.
Bitcoin price remained stable above the $16,000 support zone. BTC formed a base and slowly moved higher above the $16,350 resistance zone.
There was a move above the 23.6% Fib retracement level of the downward move from the $18,155 swing high to $15,833 low. The bulls were able to contain losses and the price started to move in a range above the $16,400 level.
Bitcoin price is now trading above $16,500 and the 100 hourly simple moving average, similar to ethereum. On the upside, an immediate resistance is near the $16,900 level. There is also a connecting bearish trend line forming with resistance near $16,900 on the hourly chart of the BTC/USD pair.
The trend line is near the 50% Fib retracement level of the downward move from the $18,155 swing high to $15,833 low. The first major resistance is near the $17,000 zone. A clear move above the $17,000 resistance might start a decent increase.
Source: BTCUSD on TradingView.com
The next major resistance is near $17,265, above which the price could test the $18,000 zone. Any more gains might send the price towards the $18,500 resistance zone.
If bitcoin fails to start a recovery wave above the $17,000 resistance zone, it could start a fresh decline. An immediate support on the downside is near the $16,650 level and the 100 hourly SMA.
The next major support is near the $16,350 zone. A clear move below the $16,350 support might push the price further lower. In this case, the price may perhaps decline towards the $16,000 support zone.
Technical indicators:
Hourly MACD – The MACD is now losing pace in the bullish zone.
Hourly RSI (Relative Strength Index) – The RSI for BTC/USD is now above the 50 level.
Major Support Levels – $16,350, followed by $16,000.
Major Resistance Levels – $16,900, $17,000 and $17,500.
Tags: bitcoinbtcusdBTCUSDTxbtusd
NewsBTCRead More
The crypto market has been showing signs of recovery, with the Bitcoin price trying to…
As quantum computing inches closer to reality, nearly 7 million bitcoin, including Satoshi Nakamoto’s 1…
President Donald Trump raised the global tariff rate to 15% despite a Supreme Court ruling…
A modest claim. A bold number. Both are on the table for Bitcoin this week…
Over the past two weeks, the Bitcoin market saw an overwhelming sellers’ dominance, with no…
Market analyst Michaël van de Poppe has noted an important on-chain development that implies a…