Bitcoin price struggled to stay above $70,000 and corrected gains. BTC is now trading below $69,000 and showing a few bearish signs.
Bitcoin extended its downside correction below the $69,000 zone.
The price is trading below $69,000 and the 100 hourly Simple moving average.
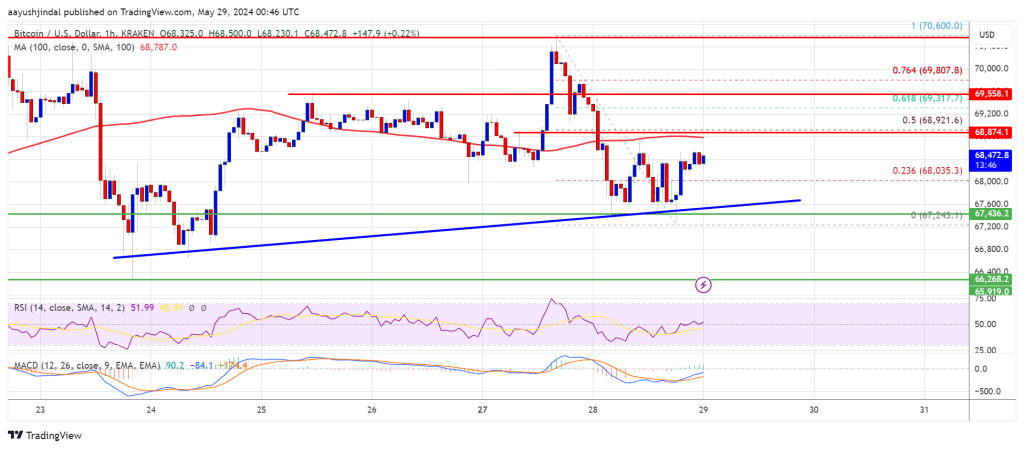
There is a key bullish trend line forming with support at $67,600 on the hourly chart of the BTC/USD pair (data feed from Kraken).
The pair could start another increase unless there is a move below the $67,500 support.
Bitcoin price started a downside correction after it failed to stay above the $70,000 support. BTC declined below the $69,200 and $68,500 support levels.
The price even dipped below the $67,500 support. A low has formed at $67,243 and the price is now consolidating losses. It moved above the $68,000 level and the 23.6% Fib retracement level of the downward move from the $70,600 swing high to the $67,243 low.
Bitcoin is now trading below $69,000 and the 100 hourly Simple moving average. However, there is a key bullish trend line forming with support at $67,600 on the hourly chart of the BTC/USD pair.
If there is a fresh increase, the price might face resistance near the $68,800 level. The first major resistance could be $69,000 or the 50% Fib retracement level of the downward move from the $70,600 swing high to the $67,243 low.
The next key resistance could be $69,550. A clear move above the $69,550 resistance might send the price higher. In the stated case, the price could rise and test the $70,600 resistance. Any more gains might send BTC toward the $72,000 resistance.
If Bitcoin fails to climb above the $69,000 resistance zone, it could continue to move down. Immediate support on the downside is near the $67,650 level and the trend line.
The first major support is $67,500. The next support is now forming near $66,250. Any more losses might send the price toward the $65,000 support zone in the near term.
Technical indicators:
Hourly MACD – The MACD is now losing pace in the bearish zone.
Hourly RSI (Relative Strength Index) – The RSI for BTC/USD is now above the 50 level.
Major Support Levels – $67,500, followed by $66,250.
Major Resistance Levels – $69,000, and $70,600.
[#item_full_content]NewsBTCRead MoreBitcoin Magazine Bitcoin Sentiment Is Turning Bullish — But It’s Too Early to Celebrate: Report…
Bitcoin slipped below $63,000 as the wider risk trade came under pressure, with weakness in…
Bitcoin Magazine Bitcoin Mining Giant Foundry Asks Miners To Vote on BIP-110 Soft Fork Foundry…
Bitcoin Magazine Bitcoin Price Falls Under $63,000 on U.S.-Iran Strikes and Trump’s China Charge, but…
Moonshot's Kimi K3 took the top spot in frontend coding away from Claude and OpenAI,…
Your day-ahead look for July 17, 2026Read MoreCoinDesk: Bitcoin, Ethereum, Crypto News and Price Data[#item_full_content]