Bitcoin price is struggling to recover above $112,500. BTC is now consolidating and might decline if there is a move below the $110,800 level.
Bitcoin started a recovery wave above the $110,800 zone.
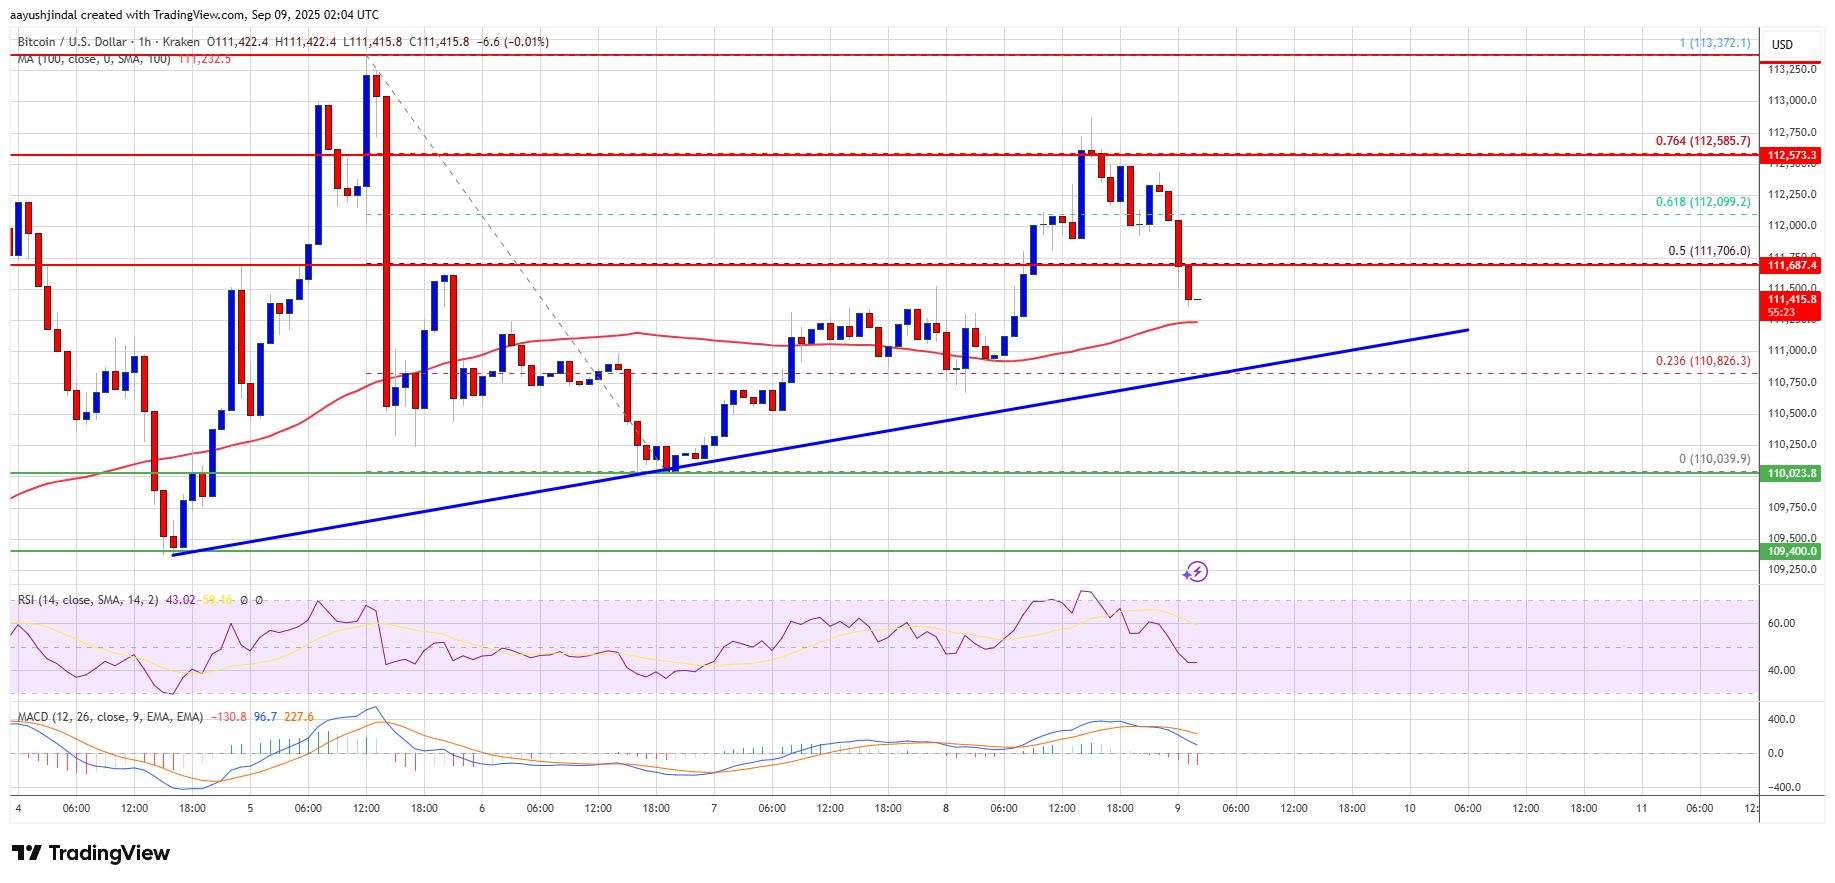
The price is trading above $111,000 and the 100 hourly Simple moving average.
There is a bullish trend line forming with support at $110,800 on the hourly chart of the BTC/USD pair (data feed from Kraken).
The pair might start another decline if it stays below the $113,000 zone.
Bitcoin price started a fresh recovery wave from the $110,000 zone. BTC managed to climb above the $110,800 and $111,200 resistance levels.
The bulls were able to push the price above the 50% Fib retracement level of the key decline from the $113,372 swing high to the $110,039 low. However, the bears remained active near the $112,600 zone and prevented more gains.
The 76.4% Fib retracement level of the key decline from the $113,372 swing high to the $110,039 low acted as a resistance. Bitcoin is now trading above $111,000 and the 100 hourly Simple moving average. Besides, there is a bullish trend line forming with support at $110,800 on the hourly chart of the BTC/USD pair.
Immediate resistance on the upside is near the $111,750 level. The first key resistance is near the $112,000 level. The next resistance could be $112,550. A close above the $112,550 resistance might send the price further higher. In the stated case, the price could rise and test the $113,000 resistance level. Any more gains might send the price toward the $114,200 level. The main target could be $115,000.
If Bitcoin fails to rise above the $112,550 resistance zone, it could start a fresh decline. Immediate support is near the $110,800 level and the trend line. The first major support is near the $110,500 level.
The next support is now near the $110,000 zone. Any more losses might send the price toward the $108,800 support in the near term. The main support sits at $107,500, below which BTC might decline sharply.
Technical indicators:
Hourly MACD – The MACD is now losing pace in the bullish zone.
Hourly RSI (Relative Strength Index) – The RSI for BTC/USD is now below the 50 level.
Major Support Levels – $110,800, followed by $110,000.
Major Resistance Levels – $112,550 and $113,000.
[#item_full_content]NewsBTCRead MoreFor readers tracking where the market is actually changing, this is the part that matters.…
The headline number is useful, but the real story is what it says about positioning.…
Bitcoin Magazine Bitcoin Exchange Inflows Spike to 49,000 BTC in a Day, Signaling More Volatility…
Bitcoin Magazine Wavespace Launches MiCA-Compliant Self-Custodial Bitcoin Debit Card Powered by Lightning and NWC Wavespace,…
For readers tracking where the market is actually changing, this is the part that matters.…
The headline number is useful, but the real story is what it says about positioning.…