Bitcoin price is struggling to recover above $112,500. BTC is now consolidating and might decline if there is a move below the $110,800 level.
Bitcoin started a recovery wave above the $110,800 zone.
The price is trading above $111,000 and the 100 hourly Simple moving average.
There is a bullish trend line forming with support at $110,800 on the hourly chart of the BTC/USD pair (data feed from Kraken).
The pair might start another decline if it stays below the $113,000 zone.
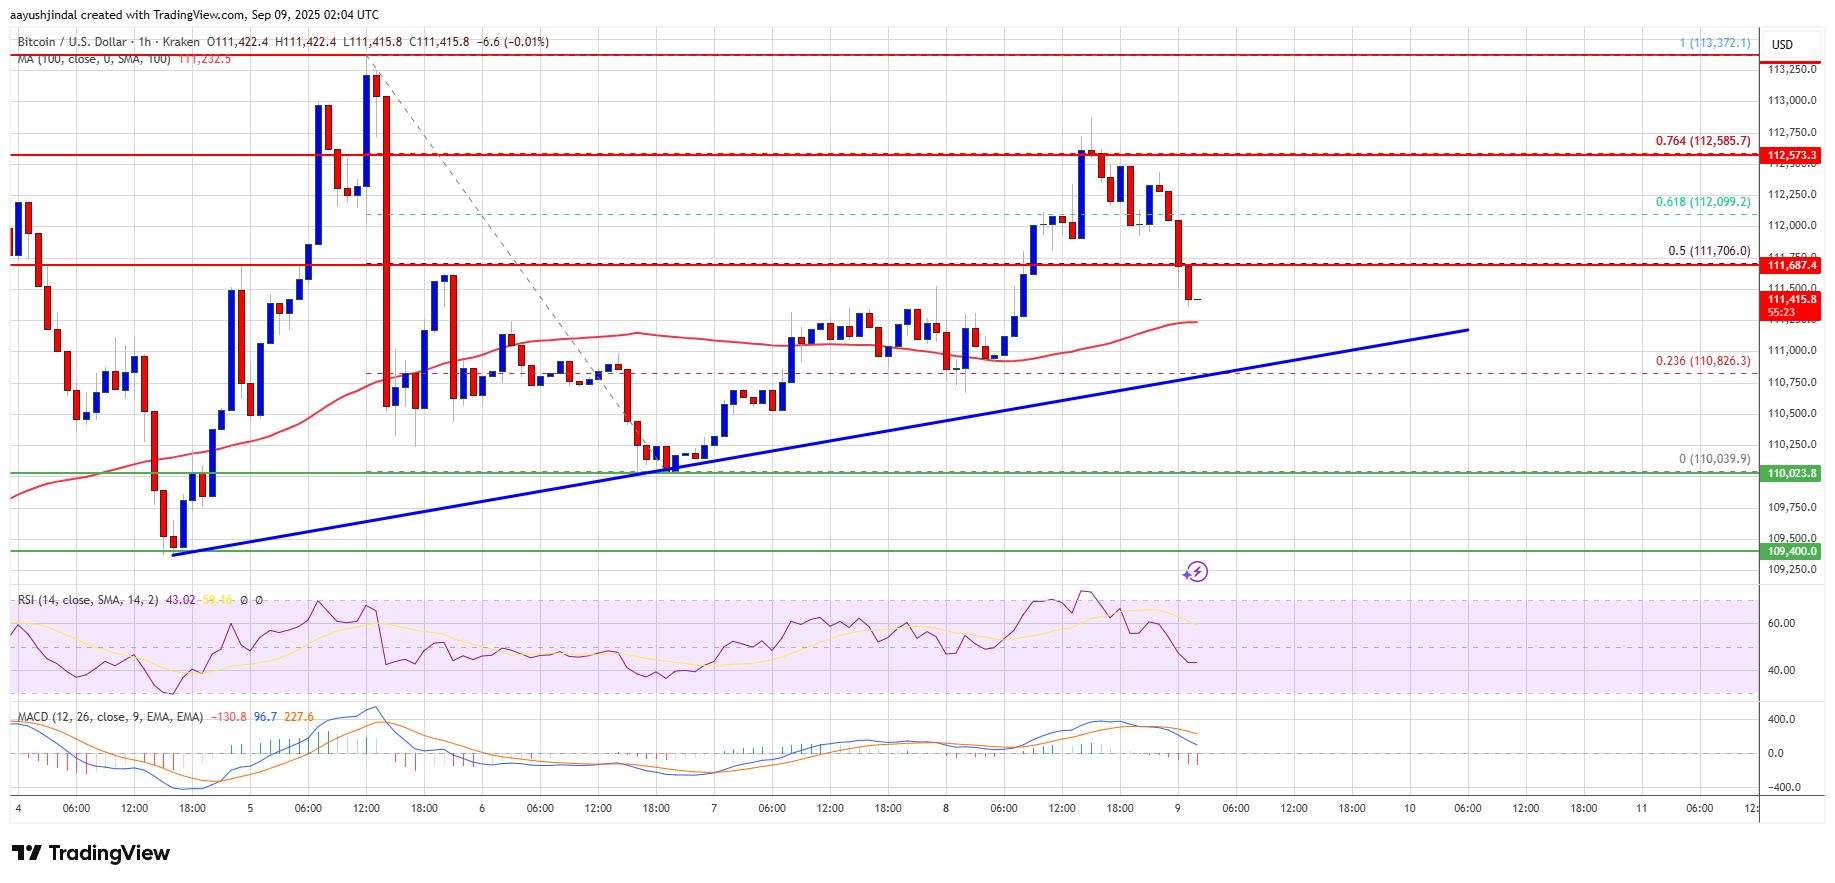
Bitcoin price started a fresh recovery wave from the $110,000 zone. BTC managed to climb above the $110,800 and $111,200 resistance levels.
The bulls were able to push the price above the 50% Fib retracement level of the key decline from the $113,372 swing high to the $110,039 low. However, the bears remained active near the $112,600 zone and prevented more gains.
The 76.4% Fib retracement level of the key decline from the $113,372 swing high to the $110,039 low acted as a resistance. Bitcoin is now trading above $111,000 and the 100 hourly Simple moving average. Besides, there is a bullish trend line forming with support at $110,800 on the hourly chart of the BTC/USD pair.
Immediate resistance on the upside is near the $111,750 level. The first key resistance is near the $112,000 level. The next resistance could be $112,550. A close above the $112,550 resistance might send the price further higher. In the stated case, the price could rise and test the $113,000 resistance level. Any more gains might send the price toward the $114,200 level. The main target could be $115,000.
If Bitcoin fails to rise above the $112,550 resistance zone, it could start a fresh decline. Immediate support is near the $110,800 level and the trend line. The first major support is near the $110,500 level.
The next support is now near the $110,000 zone. Any more losses might send the price toward the $108,800 support in the near term. The main support sits at $107,500, below which BTC might decline sharply.
Technical indicators:
Hourly MACD – The MACD is now losing pace in the bullish zone.
Hourly RSI (Relative Strength Index) – The RSI for BTC/USD is now below the 50 level.
Major Support Levels – $110,800, followed by $110,000.
Major Resistance Levels – $112,550 and $113,000.
[#item_full_content]NewsBTCRead MoreBitcoin price failed to stay above $68,800 and started another decline. BTC is now trading…
Bitcoin (BTC) resumed its downward trajectory on Thursday, falling toward $65,645 at the time of…
The Bitcoin price crash toward $60,000 has sparked debate across the crypto market, but recent…
The strong correlation between crypto and the software sector reasserted itself on WednesdayRead MoreCoinDesk: Bitcoin,…
Bitcoin Magazine Thailand Moves to Cement Bitcoin and Digital Assets in Regulated Derivatives Market Thailand…
Bitcoin Magazine Strategy (MSTR) Accounted for 97.5% of Corporate Bitcoin Buying Last Month, Report Shows…