Bitcoin price extended its decline below the $68,000 level. BTC is now slowly moving lower toward the $66,250 support zone in the near term.
Bitcoin extended its downside correction below the $68,000 zone.
The price is trading below $68,500 and the 100 hourly Simple moving average.
There is a key bearish trend line forming with resistance at $67,900 on the hourly chart of the BTC/USD pair (data feed from Kraken).
The pair could continue to move down unless there is a close above the $68,500 level.
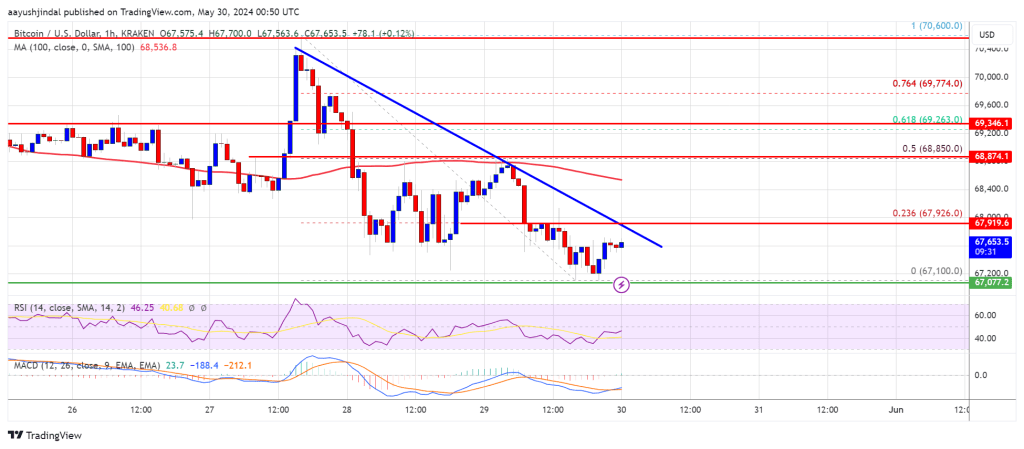
Bitcoin price extended its downside correction below the $69,000 level. BTC bears were able to push the price below the $68,000 support. Finally, the price tested the $67,000 zone.
A low has formed at $67,100 and the price is now consolidating losses. It recovered above the $67,5000 level and the 23.6% Fib retracement level of the downward wave from the $70,600 swing high to the $67,100 low, with a bearish angle.
Bitcoin is now trading below $68,500 and the 100 hourly Simple moving average. On the upside, the price is facing resistance near the $68,000 level. There is also a key bearish trend line forming with resistance at $67,900 on the hourly chart of the BTC/USD pair.
The first major resistance could be $68,800 or the 50% Fib retracement level of the downward wave from the $70,600 swing high to the $67,100 low.
The next key resistance could be $69,250. A clear move above the $69,250 resistance might send the price higher. In the stated case, the price could rise and test the $70,000 resistance. Any more gains might send BTC toward the $72,600 resistance.
If Bitcoin fails to climb above the $68,000 resistance zone, it could continue to move down. Immediate support on the downside is near the $67,250 level.
The first major support is $67,000. The next support is now forming near $66,250. Any more losses might send the price toward the $65,000 support zone in the near term.
Technical indicators:
Hourly MACD – The MACD is now losing pace in the bearish zone.
Hourly RSI (Relative Strength Index) – The RSI for BTC/USD is now above the 50 level.
Major Support Levels – $67,100, followed by $66,250.
Major Resistance Levels – $68,000, and $68,800.
[#item_full_content]NewsBTCRead MoreThe Relative Strength Index (RSI), a popular technical trading indicator, has plunged to 17. Only…
Bitcoin Magazine The v2 Transport: Bitcoin P2P Traffic Goes Dark For nearly 15 years, all…
Bitcoin Magazine JPMorgan: Bitcoin is Now a More Attractive Investment Than Gold Long Term Bitcoin’s…
Bitcoin Magazine Summer of Bitcoin 2026 Opens Applications for University Students Worldwide Summer of Bitcoin…
Bitcoin Magazine Senator Lummis to Work With Treasury on Bitcoin Tax Guidance, Hints At Potential…
Larger rival Sberbank beat Sovcombank to the punch, but it's still running as a pilot…