Bitcoin price declined and retested the $55,600 support zone. BTC is now struggling and might face hurdles near the $57,000 resistance level.
Bitcoin is struggling to recover above the $57,750 zone.
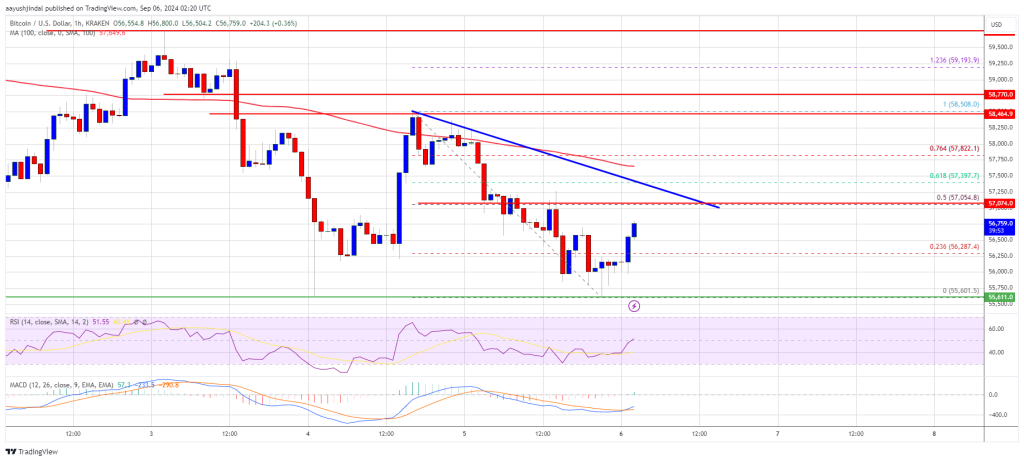
The price is trading below $57,200 and the 100 hourly Simple moving average.
There is a connecting bearish trend line forming with resistance at $57,050 on the hourly chart of the BTC/USD pair (data feed from Kraken).
The pair could struggle to recover above the $57,000 or $57,750 resistance levels in the near term.
Bitcoin price attempted a recovery wave above the $57,500 level. However, the bears were active near the $58,500 resistance level. A high was formed at $58,508 and the price started another decline.
It retested the $55,600 support zone. A low was formed at $55,601 and the price recently started a recovery wave. There was a move above the $56,000 and $56,200 resistance levels. It cleared the 23.6% Fib retracement level of the downward move from the $58,508 swing high to the $55,601 low.
Bitcoin is now trading below $57,200 and the 100 hourly Simple moving average. On the upside, the price could face resistance near the $57,000 level. There is also a connecting bearish trend line forming with resistance at $57,050 on the hourly chart of the BTC/USD pair.
The trend line is close to the 50% Fib retracement level of the downward move from the $58,508 swing high to the $55,601 low. The first key resistance is near the $57,750 level. A clear move above the $57,750 resistance might send the price further higher in the coming sessions.
The next key resistance could be $58,500. A close above the $58,500 resistance might spark more upsides. In the stated case, the price could rise and test the $60,000 resistance.
If Bitcoin fails to rise above the $57,750 resistance zone, it could start another decline. Immediate support on the downside is near the $56,000 level.
The first major support is $55,600. The next support is now near the $55,000 zone. Any more losses might send the price toward the $53,500 support in the near term.
Technical indicators:
Hourly MACD – The MACD is now losing pace in the bearish zone.
Hourly RSI (Relative Strength Index) – The RSI for BTC/USD is now near the 50 level.
Major Support Levels – $56,000, followed by $55,600.
Major Resistance Levels – $57,050, and $57,750.
[#item_full_content]NewsBTCRead MoreThe crypto financial services firm is funding developers to strengthen the blockchain's security before quantum…
Claude Fabel 5 disproved the Jacobian conjecture over the weekend, landing days after the capabilities…
Bitcoin Magazine Hyperscale Data Buys More Bitcoin, Bridging Holdings to Over $72 million Hyperscale Data,…
Bitcoin Magazine Bitcoin Price Closes in on $67,000, Lifting Strategy and Other Crypto Stocks Bitcoin’s…
Strategy Pauses Bitcoin Buying As Cash Reserve Hits $3.225B Strategy has paused its weekly Bitcoin…
Metaplanet Unit Secures ¥9.66B Financing As Bitcoin Treasury Plan Expands Metaplanet’s Bitcoin strategy is expanding…