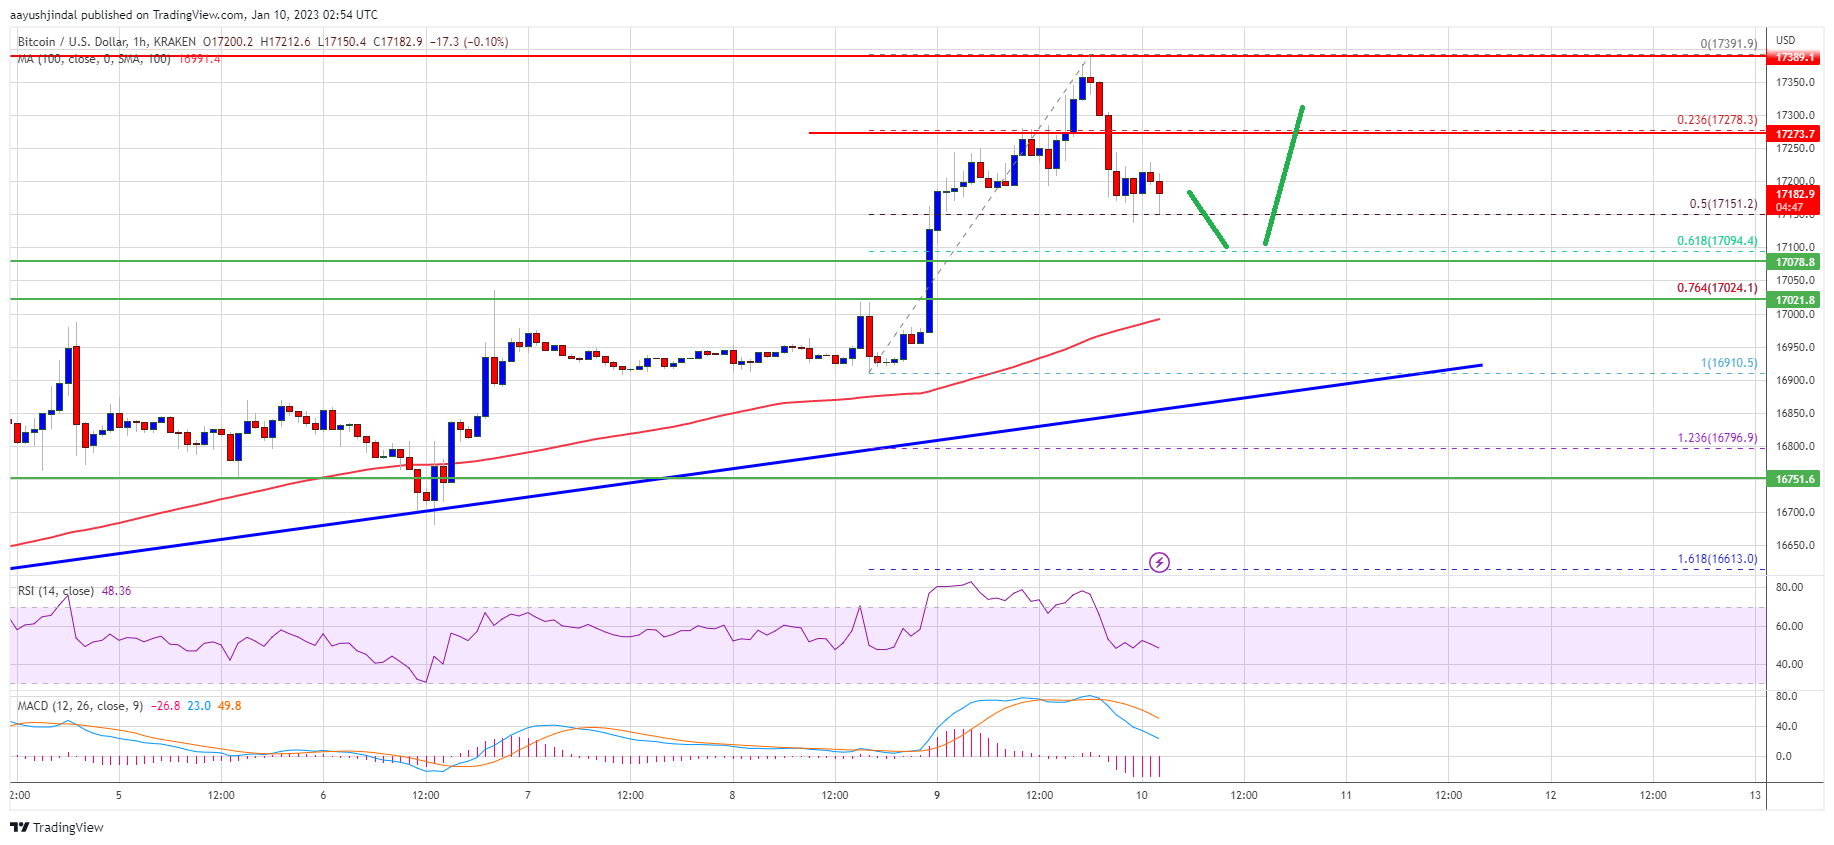
Bitcoin price extended its rise and traded towards $17,400. BTC is correcting gains, but it remains well supported near the $17,000 zone.
Bitcoin extended its increase above the $17,000 and $17,200 resistance levels.
The price is trading above $17,000 and the 100 hourly simple moving average.
There is a key bullish trend line forming with support near $16,880 on the hourly chart of the BTC/USD pair (data feed from Kraken).
The pair could rise further if it stays above the $17,000 support and the trend line.
Bitcoin price remained in a positive zone above the $16,800 level. BTC extended its increase after there was a clear close above the $17,000 level and the 100 hourly simple moving average.
The price gained pace and traded above the $17,250 level. It traded to a new yearly high at $17,391 before the bears appeared. There was a minor downside correction below the $17,250 level. It is now trading near the 50% Fib retracement level of the upward wave from the $16,911 swing low to $17,391 high.
Bitcoin price is now trading above $17,000 and the 100 hourly simple moving average. There is also a key bullish trend line forming with support near $16,880 on the hourly chart of the BTC/USD pair.
Source: BTCUSD on TradingView.com
On the upside, an immediate resistance is near the $17,280 level. The next major resistance is near the $17,400 zone, above which the price might even clear the $17,500 resistance. In the stated case, the price may perhaps rise towards the $18,000 level. Any more gains might send btc price towards the $18,500 level.
If bitcoin price fails to clear the $17,300 resistance, it could extend its downside correction. An immediate support on the downside is near the $17,150 level.
The next major support is near the $17,080 level. It is near the 61.8% Fib retracement level of the upward wave from the $16,911 swing low to $17,391 high. The main support is now forming near the $17,000 zone and the trend line region, below which the price might retest $16,500.
Technical indicators:
Hourly MACD – The MACD is now losing pace in the bullish zone.
Hourly RSI (Relative Strength Index) – The RSI for BTC/USD is now above the 50 level.
Major Support Levels – $17,150, followed by $17,000.
Major Resistance Levels – $17,300, $17,400 and $18,000.
Tags: bitcoinbitcoin pricebtcusdBTCUSDTxbtusd
NewsBTCRead More
Lightning Labs CTO Olaoluwa Osuntokun demos a prototype that could prevent millions of wallets from…
Bitcoin (BTC) could be preparing for another major bull rally as a Golden Cross has…
Data shows the uplift that Bitcoin and other cryptocurrencies have seen during the past day…
Bitcoin price started a strong increase above the $70,500 zone. BTC is consolidating gains and…
Bitcoin’s active address momentum has sunk to its weakest point since April 2018, even as…
A crypto analyst known as CrypFlow has outlined what he believes will certify the true…