Bitcoin price struggled to extend gains above the $66,000 resistance level. BTC is consolidating and holding gains above the $63,500 zone.
Bitcoin struggled to continue higher above the $66,000 resistance zone.
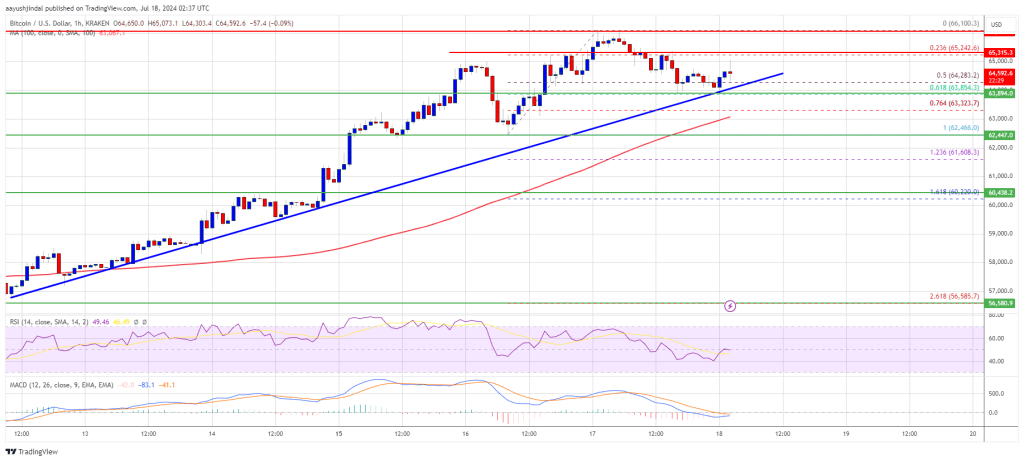
The price is trading above $63,500 and the 100 hourly Simple moving average.
There is a key bullish trend line forming with support at $64,000 on the hourly chart of the BTC/USD pair (data feed from Kraken).
The pair might continue to move up unless it breaks the $63,500 support zone.
Bitcoin price remained in a bullish zone above the $63,500 and $63,800 resistance levels. BTC made another attempt to clear the $66,000 resistance zone. However, the bulls failed to extend gains and the price started a downside correction.
There was a drop below the $65,000 and $64,500 levels. The price dipped below the 50% Fib retracement level of the upward move from the $62,465 swing low to the $66,100 high.
It found support near the $63,850 zone and the 61.8% Fib retracement level of the upward move from the $62,465 swing low to the $66,100 high. There is also a key bullish trend line forming with support at $64,000 on the hourly chart of the BTC/USD pair.
Bitcoin price is now trading above $64,000 and the 100 hourly Simple moving average. If there is a fresh increase, the price could face resistance near the $65,000 level. The first key resistance is near the $66,000 level.
A clear move above the $66,000 resistance might spark another increase in the coming sessions. The next key resistance could be $66,500. The next major hurdle sits at $67,200. A close above the $67,200 resistance might push the price further higher. In the stated case, the price could rise and test the $68,000 resistance.
If Bitcoin fails to climb above the $65,000 resistance zone, it could continue to move down. Immediate support on the downside is near the $64,000 level and the trend line.
The first major support is $63,850. The next support is now near $63,500. Any more losses might send the price toward the $62,500 support zone in the near term.
Technical indicators:
Hourly MACD – The MACD is now losing pace in the bullish zone.
Hourly RSI (Relative Strength Index) – The RSI for BTC/USD is now near the 50 level.
Major Support Levels – $64,000, followed by $63,500.
Major Resistance Levels – $65,000, and $66,000.
[#item_full_content]NewsBTCRead MoreBitcoin Magazine Till Death or Seed Phrase: Woman Accused of Spying on Husband, Stealing $172…
Bitcoin (BTC) is hanging around $74k, still respecting the post‑shock range and struggling to clear…
A falling hash rate and the resultant pressure on miners could signal another potential capitulation…
American Bitcoin (ABTC) has climbed to become the 16th-largest bitcoin holder, with 6,899 BTC, as…
Bitcoin Magazine US Senators Urge Swift Action on Bitcoin, Crypto Market Structure Bill U.S. Senators…
Bitcoin Magazine Breez SDK Launches Passkey Login for Seedless Bitcoin Wallets Breez, a lightning service…