Bitcoin price traded to a new monthly high at $21,469 before it started a downside correction. BTC could drop towards $20,600 before it starts a fresh increase.
Bitcoin gained pace above the $21,000 resistance zone before it faced sellers.
The price is trading above $20,500 and the 100 hourly simple moving average.
There is a key bearish trend line forming with resistance near $21,150 on the hourly chart of the BTC/USD pair (data feed from Kraken).
The pair could a fresh increase if it clears the $21,150 and $21,400 resistance levels.
Bitcoin price remained well bid above the $20,600 and $20,500 levels. BTC gained pace for a move above the $21,000 resistance zone and a close above the 100 hourly simple moving average.
The price even moved above the $21,200 level. A high was formed near $21,469 before the bulls lost control. Recently, there was a downside correction below the $21,200 level. The price declined below the 23.6% Fib retracement level of the upward move from the $20,050 swing low to $21,469 high.
However, the bulls were active near the $20,900 zone and the 100 hourly simple moving average. Bitcoin price is now trading above $20,500 and the 100 hourly simple moving average.
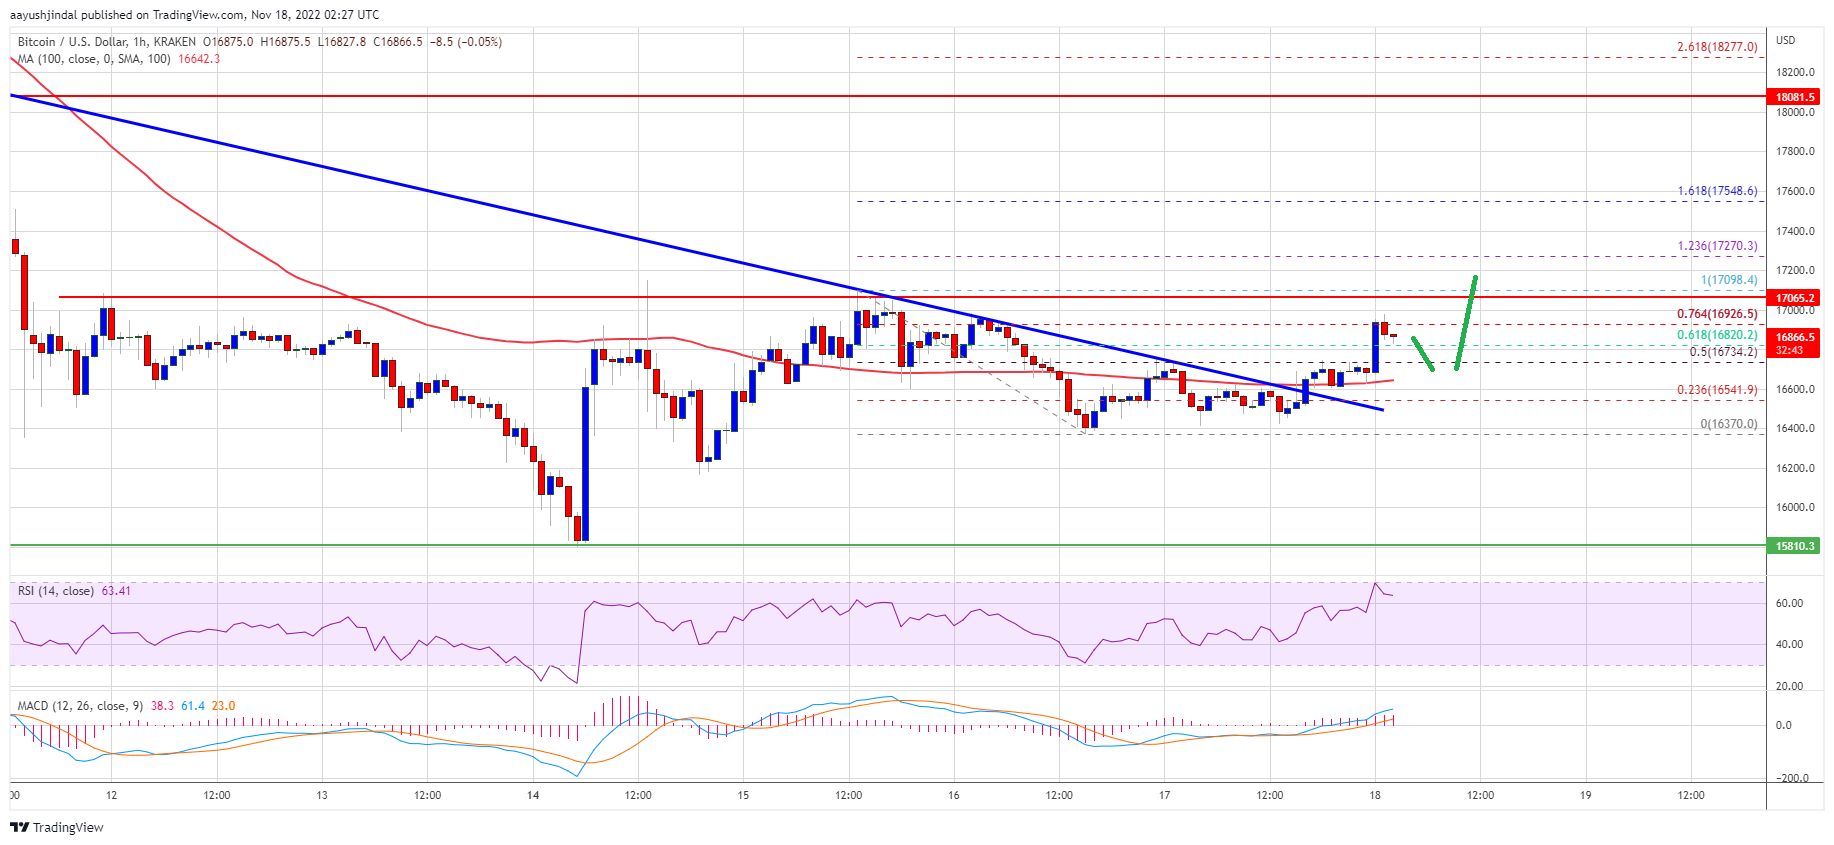
On the upside, an immediate resistance is near the $21,050 level. The first major resistance is near the $21,150 level. There is also a key bearish trend line forming with resistance near $21,150 on the hourly chart of the BTC/USD pair.
Source: BTCUSD on TradingView.com
A clear move above the trend line resistance and $21,200 might send the price towards $21,500. The next major resistance is near $22,000, above which the price may perhaps rise towards the $22,500 zone.
If bitcoin fails to clear above the $21,150 resistance zone, it could resume its decline. An immediate support on the downside is near the $20,850 zone and 100 hourly simple moving average.
The next major support is near the $20,600 zone. A clear move below the $20,600 support might push the price further lower. In this case, the price may perhaps decline towards the $20,200 level.
Technical indicators:
Hourly MACD – The MACD is now gaining pace in the bearish zone.
Hourly RSI (Relative Strength Index) – The RSI for BTC/USD is now below the 50 level.
Major Support Levels – $20,600, followed by $20,200.
Major Resistance Levels – $21,150, $21,400 and $22,000.
Bitcoin price traded to a new monthly high at $21,469 before it started a downside correction. BTC could drop towards $20,600 before it starts a fresh increase.
Bitcoin gained pace above the $21,000 resistance zone before it faced sellers.
The price is trading above $20,500 and the 100 hourly simple moving average.
There is a key bearish trend line forming with resistance near $21,150 on the hourly chart of the BTC/USD pair (data feed from Kraken).
The pair could a fresh increase if it clears the $21,150 and $21,400 resistance levels.
Bitcoin price remained well bid above the $20,600 and $20,500 levels. BTC gained pace for a move above the $21,000 resistance zone and a close above the 100 hourly simple moving average.
The price even moved above the $21,200 level. A high was formed near $21,469 before the bulls lost control. Recently, there was a downside correction below the $21,200 level. The price declined below the 23.6% Fib retracement level of the upward move from the $20,050 swing low to $21,469 high.
However, the bulls were active near the $20,900 zone and the 100 hourly simple moving average. Bitcoin price is now trading above $20,500 and the 100 hourly simple moving average.
On the upside, an immediate resistance is near the $21,050 level. The first major resistance is near the $21,150 level. There is also a key bearish trend line forming with resistance near $21,150 on the hourly chart of the BTC/USD pair.
Source: BTCUSD on TradingView.com
A clear move above the trend line resistance and $21,200 might send the price towards $21,500. The next major resistance is near $22,000, above which the price may perhaps rise towards the $22,500 zone.
If bitcoin fails to clear above the $21,150 resistance zone, it could resume its decline. An immediate support on the downside is near the $20,850 zone and 100 hourly simple moving average.
The next major support is near the $20,600 zone. A clear move below the $20,600 support might push the price further lower. In this case, the price may perhaps decline towards the $20,200 level.
Technical indicators:
Hourly MACD – The MACD is now gaining pace in the bearish zone.
Hourly RSI (Relative Strength Index) – The RSI for BTC/USD is now below the 50 level.
Major Support Levels – $20,600, followed by $20,200.
Major Resistance Levels – $21,150, $21,400 and $22,000.
Tags: bitcoinbtcusdBTCUSDTxbtusd
NewsBTCRead More
The crypto market has been showing signs of recovery, with the Bitcoin price trying to…
As quantum computing inches closer to reality, nearly 7 million bitcoin, including Satoshi Nakamoto’s 1…
President Donald Trump raised the global tariff rate to 15% despite a Supreme Court ruling…
A modest claim. A bold number. Both are on the table for Bitcoin this week…
Over the past two weeks, the Bitcoin market saw an overwhelming sellers’ dominance, with no…
Market analyst Michaël van de Poppe has noted an important on-chain development that implies a…