Bitcoin price failed to stay above $68,800 and declined further. BTC is now consolidating below $68,000 and might continue to move down.
Bitcoin started a fresh decline from well above the $70,500 zone.
The price is trading below $68,800 and the 100 hourly simple moving average.
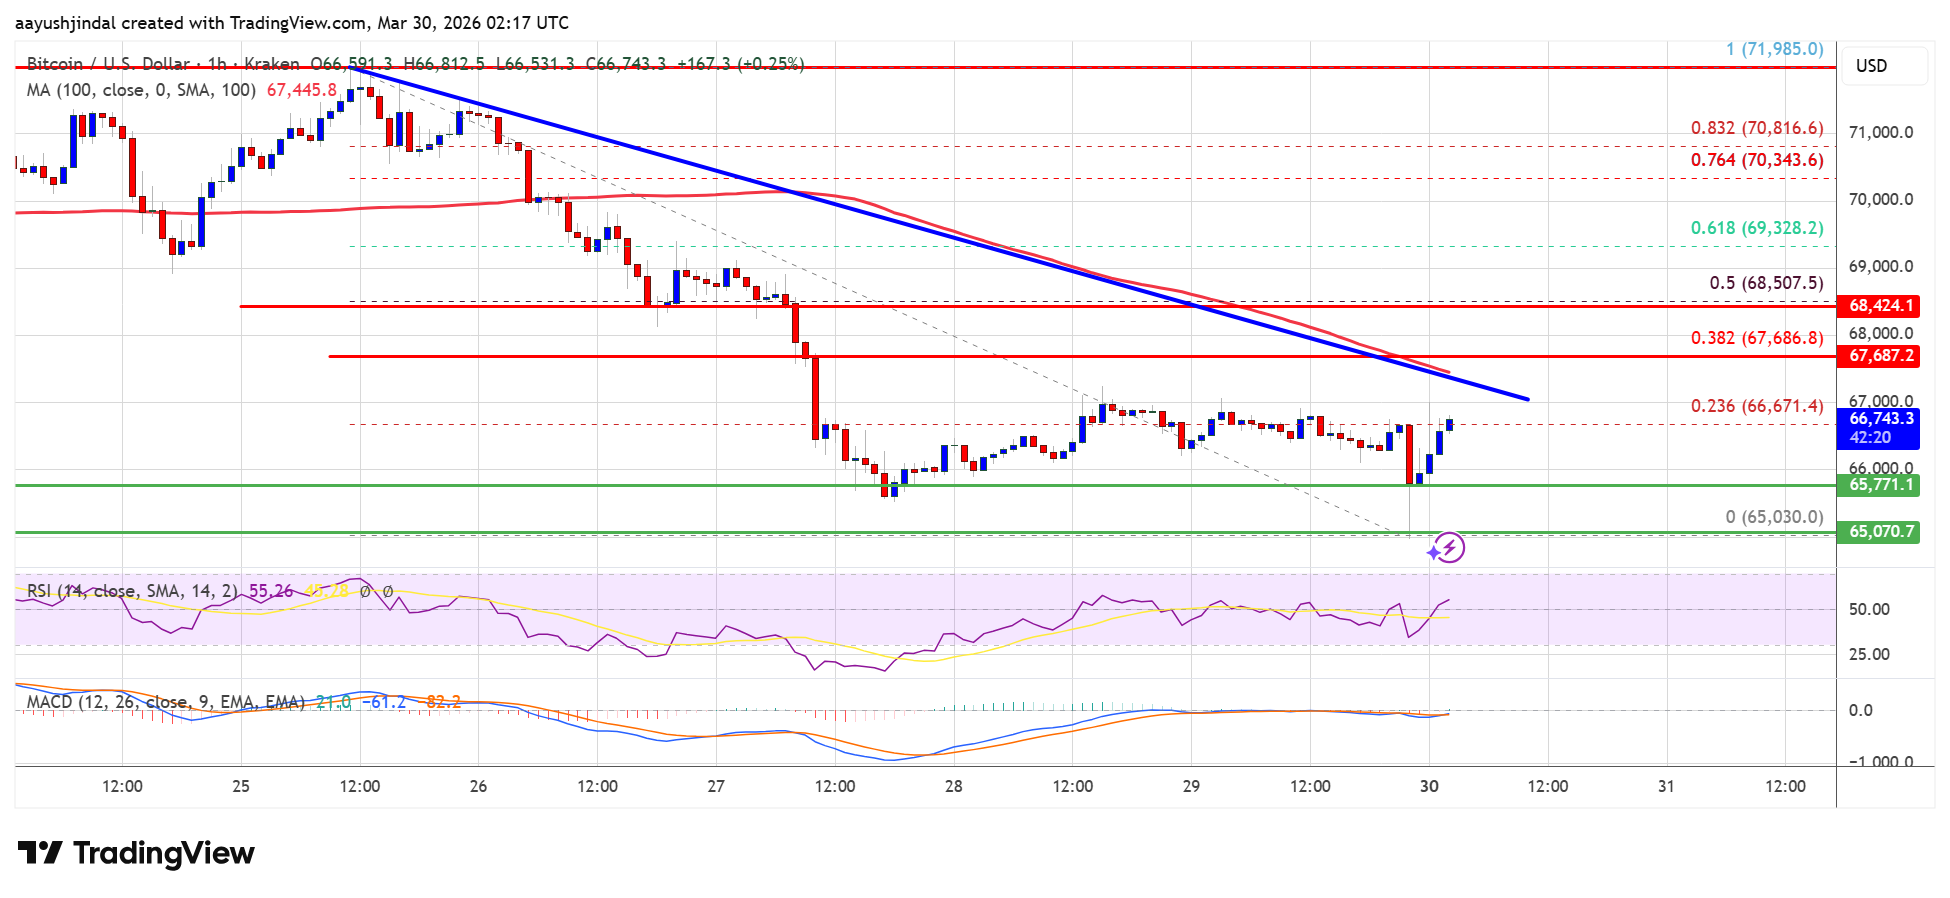
There is a bearish trend line forming with resistance at $67,250 on the hourly chart of the BTC/USD pair (data feed from Kraken).
The pair might start another decline if it stays below the $68,000 and $68,800 levels.
Bitcoin price failed to continue higher above $71,200 and reacted to the downside. BTC trimmed gains and declined below the $70,000 support.
The bears pushed the price below $68,800 and $68,000. The price tested the $65,000 zone. A low was formed at $65,030, and the price is now consolidating losses near the 23.6% Fib retracement level of the downward move from the $71,985 swing high to the $65,030 low.
Bitcoin is now trading below $68,000 and the 100 hourly simple moving average. There is also a bearish trend line forming with resistance at $67,250 on the hourly chart of the BTC/USD pair.
If the price remains stable above $65,750, it could attempt a fresh increase. Immediate resistance is near the $68,000 level. The first key resistance is near the $67,250 level and the trend line. A close above the $67,250 resistance might send the price further higher.
In the stated case, the price could rise and test the $68,500 resistance or the 50% Fib retracement level of the downward move from the $71,985 swing high to the $65,030 low. Any more gains might send the price toward the $69,200 level. The next barrier for the bulls could be $70,000.
If Bitcoin fails to rise above the $68,500 resistance zone, it could start another decline. Immediate support is near the $65,750 level. The first major support is near the $65,000 level.
The next support is now near the $64,200 zone. Any more losses might send the price toward the $64,000 support in the near term. The main support now sits at $63,500, below which BTC might struggle to recover in the near term.
Technical indicators:
Hourly MACD – The MACD is now losing pace in the bearish zone.
Hourly RSI (Relative Strength Index) – The RSI for BTC/USD is now just the 50 level.
Major Support Levels – $65,750, followed by $65,000.
Major Resistance Levels – $67,250 and $68,500.
[#item_full_content]NewsBTCRead MoreBitcoin Magazine Poetic Justice: Scammer Lost $5M in Bitcoin After Being Targeted by Ledger Thieves…
Bitcoin Magazine BFFS26 Denver: Joseph Kelly on Bitcoin Custody and Credit; Alan Lane on Banking…
Bitcoin Magazine Hot Inflation Data Puts Bitcoin Under Pressure, but ‘Difficult’ Isn’t ‘Bearish’: CoinShares Bitcoin’s…
Bitcoin Magazine Deutsche Bank To Debut Bitcoin Custody Within Weeks: Report German multinational Deutsche Bank…
Bitcoin Magazine Morgan Stanley’s Amy Oldenburg: The Digital Gold Investment Case for Bitcoin Bitcoin’s digital…
Bitcoin Magazine Math Professor Warns of Threat to Bitcoin from AI Pivot Could anyone actually…