Bitcoin price is consolidating losses above the $55,000 level. BTC must settle above $58,500 and then $60,000 to start a recovery wave.
Bitcoin dipped again and retested the $54,500 support zone.
The price is trading below $58,500 and the 100 hourly Simple moving average.
There is a connecting bearish trend line forming with resistance at $57,650 on the hourly chart of the BTC/USD pair (data feed from Kraken).
The pair might struggle to start a fresh increase above the $58,500 resistance zone.
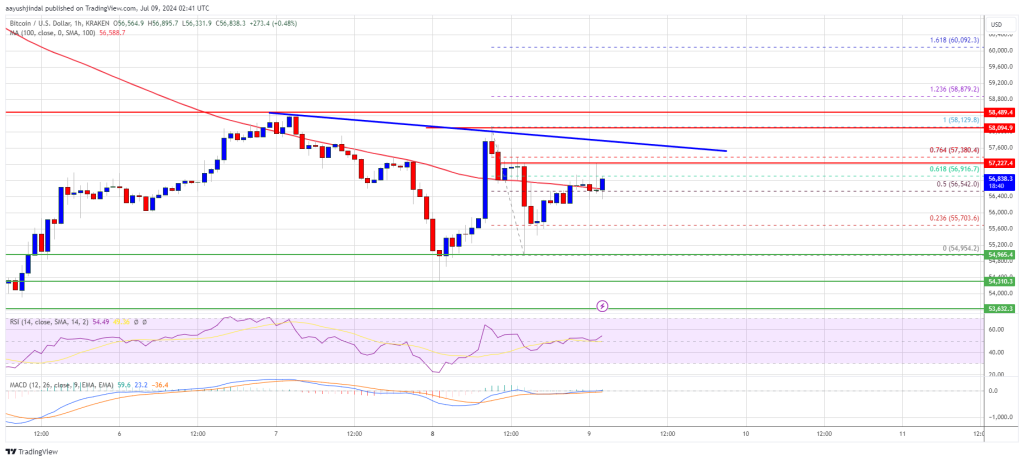
Bitcoin price attempted a recovery wave above the $56,500 level. BTC even climbed above the $57,500 level. However, it failed to continue higher above the $58,200 zone.
A high was formed at $58,129 and the price started a fresh decline. There was a drop below the $57,000 and $55,500 level. A low has formed near $54,954 and the price is now consolidating losses. There was a minor increase above the 50% Fib retracement level of the downward move from the $58,129 swing high to the $54,954 low.
Bitcoin price is still trading below $57,500 and the 100 hourly Simple moving average. Immediate resistance on the upside is near the $57,250 level or the 76.4% Fib retracement level of the downward move from the $58,129 swing high to the $54,954 low.
The first key resistance is near the $57,650 level. There is also a connecting bearish trend line forming with resistance at $57,650 on the hourly chart of the BTC/USD pair.
A clear move above the trend line might send the price toward the $58,200 level. The next key resistance could be $58,500. A close above the $58,500 resistance might start a steady increase and send the price higher. In the stated case, the price could rise and test the $60,000 resistance.
If Bitcoin fails to climb above the $57,650 resistance zone, it could start another decline. Immediate support on the downside is near the $56,000 level.
The first major support is $55,500. The next support is now near $54,500. Any more losses might send the price toward the $5,200 support zone in the near term.
Technical indicators:
Hourly MACD – The MACD is now losing pace in the bearish zone.
Hourly RSI (Relative Strength Index) – The RSI for BTC/USD is now above the 50 level.
Major Support Levels – $55,500, followed by $54,500.
Major Resistance Levels – $57,650, and $58,500.
[#item_full_content]NewsBTCRead MoreBitcoin Magazine Democrats Sanders and Warren Push Labor Department to Abandon Bitcoin 401(k) Rule Senators…
Bitcoin Magazine Bitcoin Stocks, Led By Strategy (MSTR), Take a Beating as BTC Price Sells…
The firm still views bitcoin as undervalued relative to equities, but says investors are rotating…
Ethereum is back at a point on its Bitcoin pair where the price action has…
Bitcoin Magazine A Little Story About Inflation – An Excerpt from Bitcoin: The Honest Money…
Bitcoin Magazine Charles Schwab Sets Mid-2027 Target for Advisor Bitcoin and Crypto Spot Trading Charles…