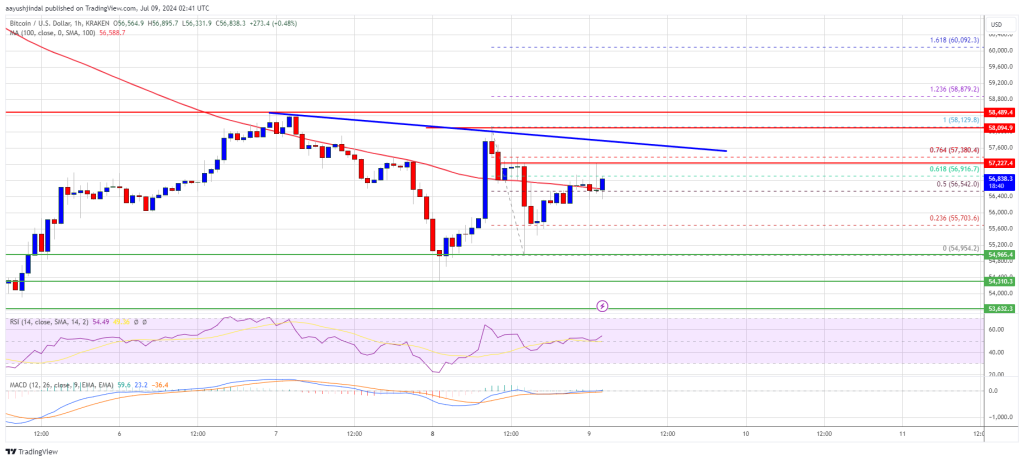
Bitcoin price is consolidating losses above the $55,000 level. BTC must settle above $58,500 and then $60,000 to start a recovery wave.
Bitcoin dipped again and retested the $54,500 support zone.
The price is trading below $58,500 and the 100 hourly Simple moving average.
There is a connecting bearish trend line forming with resistance at $57,650 on the hourly chart of the BTC/USD pair (data feed from Kraken).
The pair might struggle to start a fresh increase above the $58,500 resistance zone.
Bitcoin price attempted a recovery wave above the $56,500 level. BTC even climbed above the $57,500 level. However, it failed to continue higher above the $58,200 zone.
A high was formed at $58,129 and the price started a fresh decline. There was a drop below the $57,000 and $55,500 level. A low has formed near $54,954 and the price is now consolidating losses. There was a minor increase above the 50% Fib retracement level of the downward move from the $58,129 swing high to the $54,954 low.
Bitcoin price is still trading below $57,500 and the 100 hourly Simple moving average. Immediate resistance on the upside is near the $57,250 level or the 76.4% Fib retracement level of the downward move from the $58,129 swing high to the $54,954 low.
The first key resistance is near the $57,650 level. There is also a connecting bearish trend line forming with resistance at $57,650 on the hourly chart of the BTC/USD pair.
A clear move above the trend line might send the price toward the $58,200 level. The next key resistance could be $58,500. A close above the $58,500 resistance might start a steady increase and send the price higher. In the stated case, the price could rise and test the $60,000 resistance.
If Bitcoin fails to climb above the $57,650 resistance zone, it could start another decline. Immediate support on the downside is near the $56,000 level.
The first major support is $55,500. The next support is now near $54,500. Any more losses might send the price toward the $5,200 support zone in the near term.
Technical indicators:
Hourly MACD – The MACD is now losing pace in the bearish zone.
Hourly RSI (Relative Strength Index) – The RSI for BTC/USD is now above the 50 level.
Major Support Levels – $55,500, followed by $54,500.
Major Resistance Levels – $57,650, and $58,500.
[#item_full_content]NewsBTCRead MoreBitcoin hovered below $90,000 on Sunday as low liquidity, altcoin weakness and imminent U.S. and…
The price action of Bitcoin has been somewhat limited in the past few weeks, as…
The Bitcoin market has continued to consolidate within the $90,000 price zone over the last…
The crypto market has shown a modest price rebound in the last three weeks, returning…
Bitcoin is facing a critical juncture as its macro retracement converges with a tight mid-range…
Onchain data shows multiple cost basis metrics confirm heavy demand and investor conviction around the…