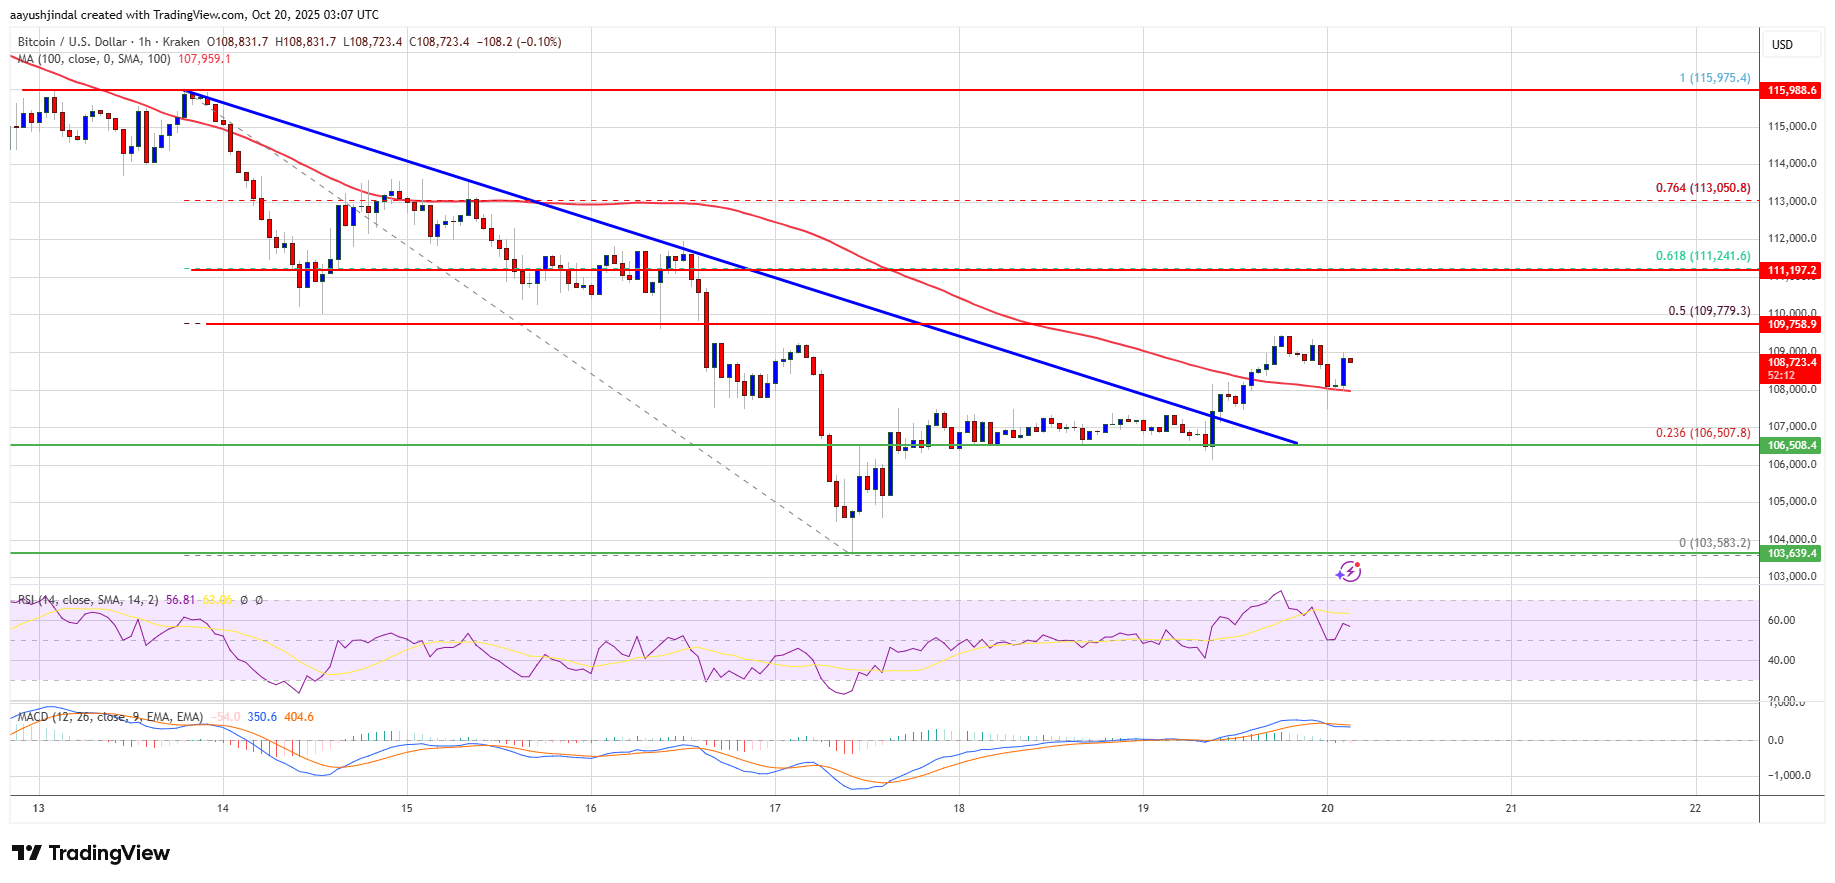
Bitcoin price is attempting to recover above $107,500 and $108,000. BTC could continue to move up if it clears the $109,500 resistance zone.
Bitcoin started a fresh recovery wave above the $105,000 resistance level.
The price is trading above $108,000 and the 100 hourly Simple moving average.
There was a break above a bearish trend line with resistance at $107,500 on the hourly chart of the BTC/USD pair (data feed from Kraken).
The pair might continue to move up if it trades above the $109,500 zone.
Bitcoin price failed to surpass the $110,000 resistance level and started a fresh decline. BTC dipped below the $108,000 and $106,500 support levels to enter a bearish zone.
The price even dipped below $105,000. A low was formed at $103,583 and the price is correcting some losses. There was a move above the 23.6% Fib retracement level of the recent decline from the $115,975 swing high to the $103,583 low.
Besides, there was a break above a bearish trend line with resistance at $107,500 on the hourly chart of the BTC/USD pair. Bitcoin is now trading above $108,000 and the 100 hourly Simple moving average.
Immediate resistance on the upside is near the $109,500 level. The first key resistance is near the $110,000 level. The next resistance could be $111,250 and the 61.8% Fib retracement level of the recent decline from the $115,975 swing high to the $103,583 low.
A close above the $111,250 resistance might send the price further higher. In the stated case, the price could rise and test the $112,500 resistance. Any more gains might send the price toward the $113,200 level. The next barrier for the bulls could be $115,000.
If Bitcoin fails to rise above the $110,000 resistance zone, it could start a fresh decline. Immediate support is near the $108,000 level. The first major support is near the $107,500 level.
The next support is now near the $106,200 zone. Any more losses might send the price toward the $105,500 support in the near term. The main support sits at $103,500, below which BTC might struggle to recover in the short term.
Technical indicators:
Hourly MACD – The MACD is now gaining pace in the bullish zone.
Hourly RSI (Relative Strength Index) – The RSI for BTC/USD is now above the 50 level.
Major Support Levels – $108,000, followed by $106,500.
Major Resistance Levels – $109,500 and $111,250.
[#item_full_content]NewsBTCRead MoreSix decade-old wallets moved $40 million this month, but Galaxy's data shows dormant coin activity…
Bitcoin Magazine Bitcoin Cools Off After $3 Billion ETF-Driven Surge Bitcoin slid Friday afternoon, cooling…
Bitcoin Magazine Bitcoin’s Moment Has Come for the Far East, Says Metaplanet CEO Bitcoin’s time…
Bitcoin Magazine Debasement Trade Is Here Thanks to Government Debt — And Bitcoin Will Benefit:…
Bitcoin Magazine Capital B Raises €21M From Adam Back and TOBAM To Buy More BTC…
Bitcoin Magazine Bitcoin Drops Before Shrugging Off Fed Chair’s Inflation Comments Bitcoin dropped, then popped…