Bitcoin price climbed further higher above $18,500. BTC tested the $19,000 resistance zone and is currently consolidating gains.
Bitcoin climbed further higher above the $18,000 and $18,500 resistance levels.
The price is trading above $18,200 and the 100 hourly simple moving average.
There is a connecting bullish trend line forming with support near $18,600 on the hourly chart of the BTC/USD pair (data feed from Kraken).
The pair could correct lower towards the $18,500 and $18,350 support levels.
Bitcoin price remained well bid above the $18,000 zone. BTC formed another bullish breakout and was able to surge above the $18,500 resistance zone, unlike ethereum.
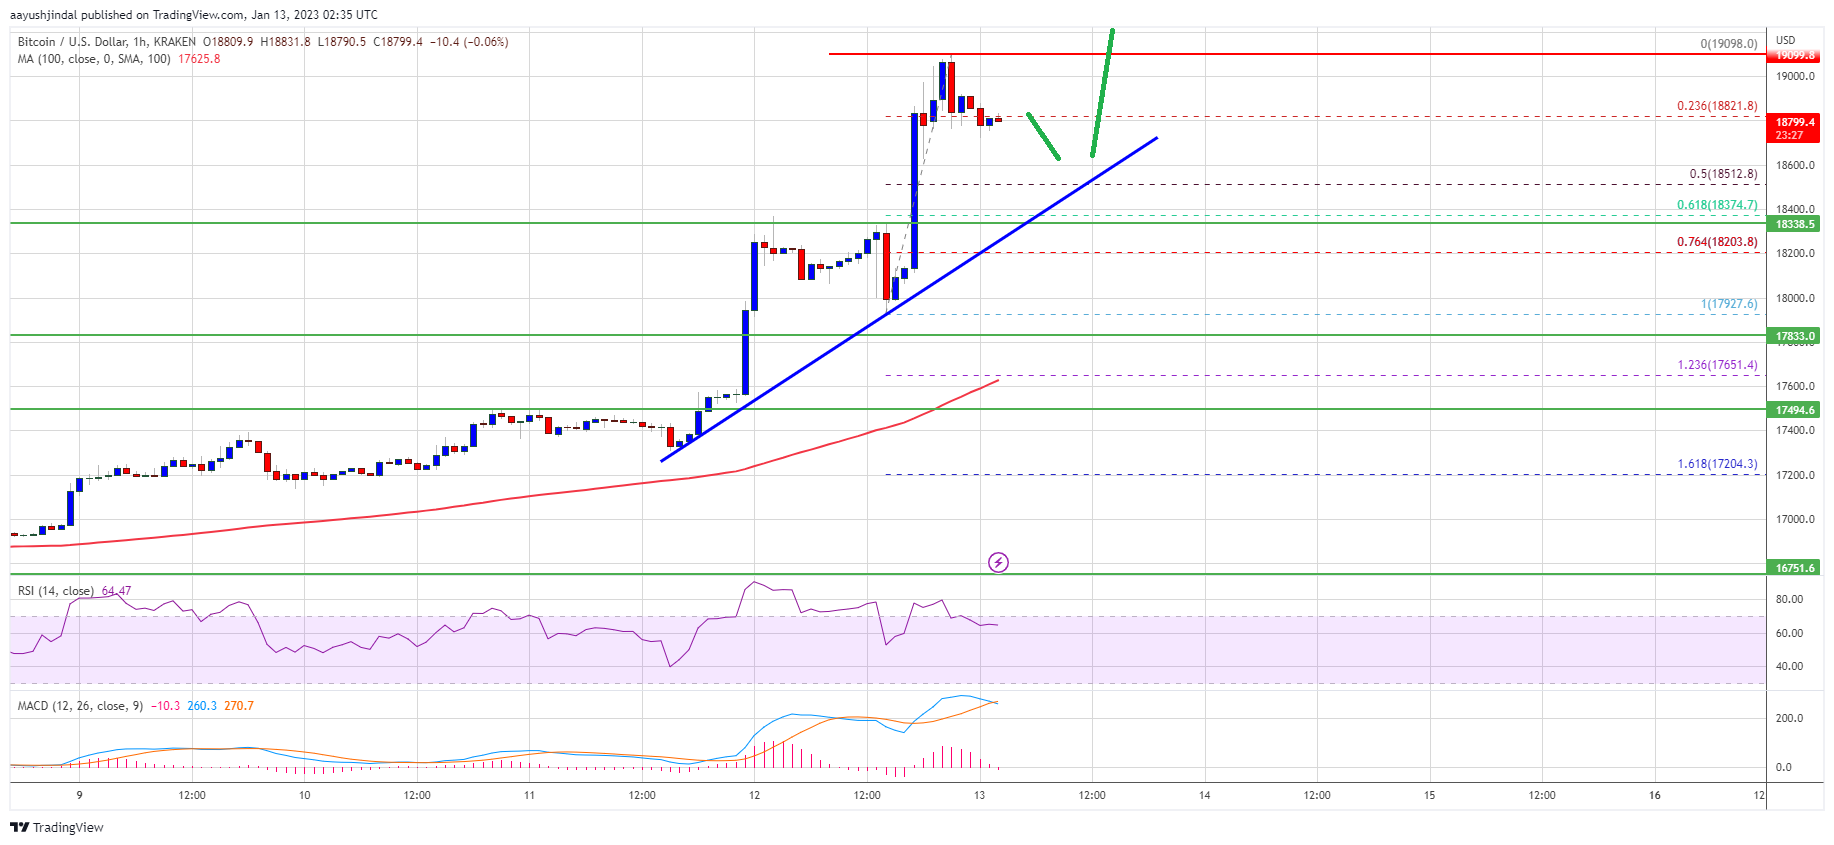
The price cleared the $18,800 resistance zone and even spiked above the $19,000 level. A high is formed near $19,098 and the price is now consolidating gains. There was a minor decline below the $18,900 level. The price declined below the 23.6% Fib retracement level of the upward move from the $17,927 swing low to $19,098 high.
Bitcoin price is trading above $18,200 and the 100 hourly simple moving average. There is also a connecting bullish trend line forming with support near $18,600 on the hourly chart of the BTC/USD pair.
Source: BTCUSD on TradingView.com
On the upside, an immediate resistance is near the $19,000 level. The next major resistance is near the $19,200 zone, above which the price might start another steady increase. In the stated case, the price may perhaps rise towards the $19,500 level. Any more gains might send btc price towards the $20,000 level.
If bitcoin price fails to clear the $19,000 resistance, it could start a downside correction. An immediate support on the downside is near the $18,650 level.
The next major support is near the $18,500 level and the trend line. It is near the 50% Fib retracement level of the upward move from the $17,927 swing low to $19,098 high. The main support is now forming near the $17,800 level, below which the price might retest $17,000.
Technical indicators:
Hourly MACD – The MACD is now losing pace in the bullish zone.
Hourly RSI (Relative Strength Index) – The RSI for BTC/USD is now above the 50 level.
Major Support Levels – $18,650, followed by $18,500.
Major Resistance Levels – $19,000, $19,200 and $20,000.
Bitcoin price climbed further higher above $18,500. BTC tested the $19,000 resistance zone and is currently consolidating gains.
Bitcoin climbed further higher above the $18,000 and $18,500 resistance levels.
The price is trading above $18,200 and the 100 hourly simple moving average.
There is a connecting bullish trend line forming with support near $18,600 on the hourly chart of the BTC/USD pair (data feed from Kraken).
The pair could correct lower towards the $18,500 and $18,350 support levels.
Bitcoin price remained well bid above the $18,000 zone. BTC formed another bullish breakout and was able to surge above the $18,500 resistance zone, unlike ethereum.
The price cleared the $18,800 resistance zone and even spiked above the $19,000 level. A high is formed near $19,098 and the price is now consolidating gains. There was a minor decline below the $18,900 level. The price declined below the 23.6% Fib retracement level of the upward move from the $17,927 swing low to $19,098 high.
Bitcoin price is trading above $18,200 and the 100 hourly simple moving average. There is also a connecting bullish trend line forming with support near $18,600 on the hourly chart of the BTC/USD pair.
Source: BTCUSD on TradingView.com
On the upside, an immediate resistance is near the $19,000 level. The next major resistance is near the $19,200 zone, above which the price might start another steady increase. In the stated case, the price may perhaps rise towards the $19,500 level. Any more gains might send btc price towards the $20,000 level.
If bitcoin price fails to clear the $19,000 resistance, it could start a downside correction. An immediate support on the downside is near the $18,650 level.
The next major support is near the $18,500 level and the trend line. It is near the 50% Fib retracement level of the upward move from the $17,927 swing low to $19,098 high. The main support is now forming near the $17,800 level, below which the price might retest $17,000.
Technical indicators:
Hourly MACD – The MACD is now losing pace in the bullish zone.
Hourly RSI (Relative Strength Index) – The RSI for BTC/USD is now above the 50 level.
Major Support Levels – $18,650, followed by $18,500.
Major Resistance Levels – $19,000, $19,200 and $20,000.
Tags: bitcoinbitcoin pricebtcusdBTCUSDTxbtusd
NewsBTCRead More
Gold shed billions in March. Bitcoin quietly pulled in more than a billion. Flows Tell…
As Bitcoin (BTC) holds the crucial $65,000 to $66,000 area, Ark Invest CEO and CIO…
On-chain data shows the large Bitcoin holders have been participating in a notable amount of…
Google's quantum paper made headlines with that number. Here's what it means, what's actually at…
Ethereum could outpace Bitcoin by a wide margin over the next four years — at…
Bitcoin is often celebrated as a decentralized network, with mining power distributed globally to ensure…