Bitcoin price is up nearly 5% and there was a move above $62,500. BTC is now testing the $63,500 resistance zone with a positive angle.
Bitcoin started a decent increase above the $62,200 and $62,400 levels.
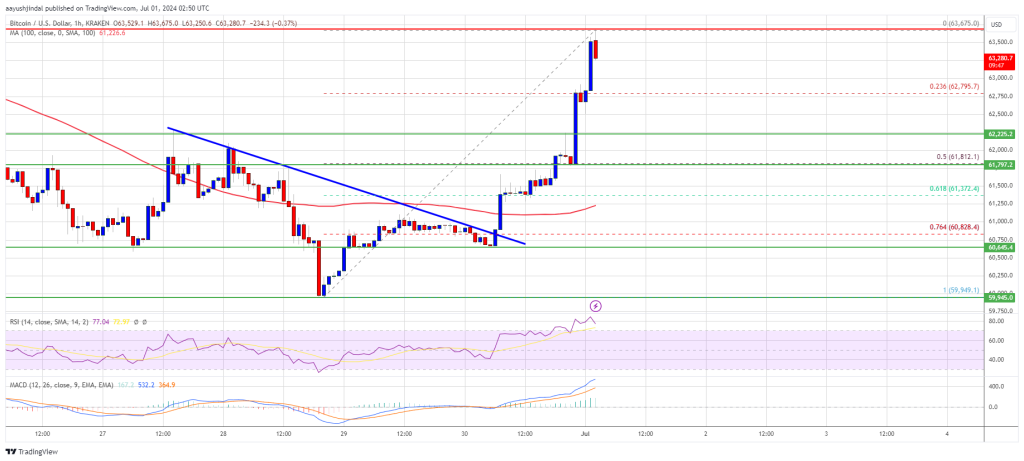
The price is trading above $62,500 and the 100 hourly Simple moving average.
There was a break above a major bearish trend line with resistance at $61,000 on the hourly chart of the BTC/USD pair (data feed from Kraken).
The pair might struggle to continue higher above the $63,650 resistance zone.
Bitcoin price formed a base above the $60,000 zone. BTC remained stable and was able to start a decent increase above the $61,500 resistance zone.
There was a break above a major bearish trend line with resistance at $61,000 on the hourly chart of the BTC/USD pair. The bulls were able to pump the price above the $62,500 resistance. It is up nearly 5% and trading near the $63,650 resistance zone.
Bitcoin price is trading above $62,500 and the 100 hourly Simple moving average. It is stable and well above the 23.6% Fib retracement level of the upward move from the $59,949 swing low to the $63,675 high.
If there is another increase, the price could face resistance near the $63,650 level. The first key resistance is near the $64,000 level. The next key resistance could be $64,400. A clear move above the $64,400 resistance might start a steady increase and send the price higher.
In the stated case, the price could rise and test the $65,500 resistance. Any more gains might send BTC toward the $66,000 resistance in the near term.
If Bitcoin fails to climb above the $63,650 resistance zone, it could start a downside correction. Immediate support on the downside is near the $62,800 level.
The first major support is $61,800 and the 50% Fib retracement level of the upward move from the $59,949 swing low to the $63,675 high. The next support is now forming near $61,250 and the 100 hourly Simple moving average. Any more losses might send the price toward the $60,500 support zone in the near term.
Technical indicators:
Hourly MACD – The MACD is now gaining pace in the bullish zone.
Hourly RSI (Relative Strength Index) – The RSI for BTC/USD is now above the 50 level.
Major Support Levels – $62,800, followed by $61,800.
Major Resistance Levels – $63,650, and $64,400.
[#item_full_content]NewsBTCRead MoreGoogle's quantum paper made headlines with that number. Here's what it means, what's actually at…
Ethereum could outpace Bitcoin by a wide margin over the next four years — at…
Bitcoin is often celebrated as a decentralized network, with mining power distributed globally to ensure…
Bitcoin (BTC) faces a stark downside risk that could send prices below the previous bear…
Crypto analyst Jordan has predicted that the Bitcoin price could rally to $80,000 in the…
The financial services giant with almost $12 trillion in client assets is moving closer to…