Bitcoin price gained over 8% and surged above $70,000. BTC is now consolidating gains and showing signs of more upsides in the near term.
Bitcoin started a fresh increase above the $70,000 resistance zone.
The price is trading above $79,000 and the 100 hourly Simple moving average.
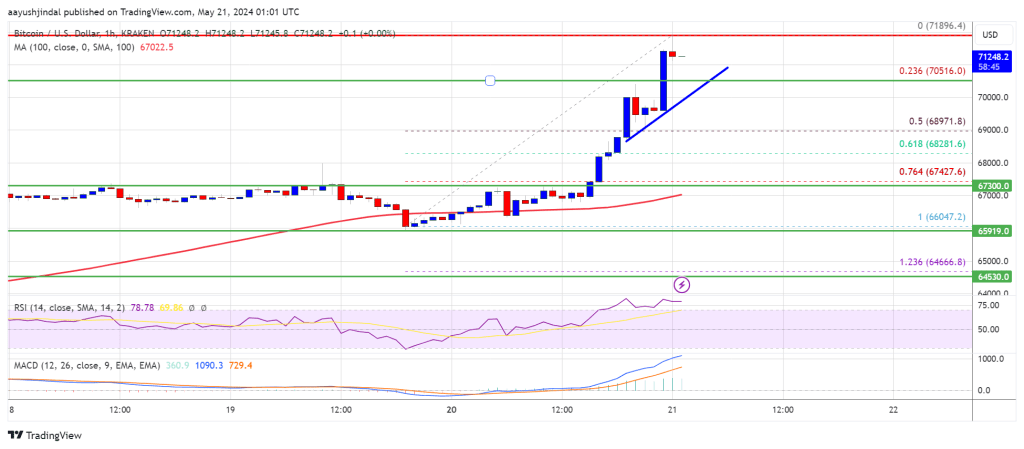
There is a connecting bullish trend line forming with support at $70,500 on the hourly chart of the BTC/USD pair (data feed from Kraken).
The pair could start another increase unless the bears push it below $68,800.
Bitcoin price formed a base above the $66,500 level. BTC started a fresh increase above the $68,000 resistance zone after Ethereum rallied above $3,200.
There was a strong move above the $70,000 resistance zone. The price gained over 8% and even tested the $72,000 resistance zone. A new weekly high was formed at $71,896 and the price is now consolidating gains.
The price is well above the 23.6% Fib retracement level of the upward move from the $66,047 swing low to the $71,896 high. Bitcoin is also trading above $79,000 and the 100 hourly Simple moving average. Besides, there is a connecting bullish trend line forming with support at $70,500 on the hourly chart of the BTC/USD pair.
The price is now facing resistance near the $71,850 level. The first major resistance could be $72,000. The next key resistance could be $72,500. A clear move above the $72,500 resistance might send the price higher. In the stated case, the price could rise and test the $73,200 resistance.
If the bulls remain in action, the price could rise toward the $74,400 resistance zone. Any more gains might send BTC toward the $75,000 barrier.
If Bitcoin fails to climb above the $72,000 resistance zone, it could start a downside correction. Immediate support on the downside is near the $70,500 level and the trend line.
The first major support is $70,000. The main support is now forming near $68,850 or the 50% Fib retracement level of the upward move from the $66,047 swing low to the $71,896 high. Any more losses might send the price toward the $67,450 support zone in the near term.
Technical indicators:
Hourly MACD – The MACD is now gaining pace in the bullish zone.
Hourly RSI (Relative Strength Index) – The RSI for BTC/USD is now above the 70 level.
Major Support Levels – $70,500, followed by $70,000.
Major Resistance Levels – $71,850, $72,000, and $72,500.
[#item_full_content]NewsBTCRead MoreBitcoin Magazine Bitcoin ETFs Bled Nearly Half a Billion Dollars End of Last Week, Reversing…
Bitcoin Magazine Strategy Skips Bitcoin Again, Buys Back $25M of STRC Stock Bitcoin treasury Strategy…
The Ethereum treasury company added nearly 10,000 ETH while expanding its stock buyback, citing ether…
The put/call ratio has fallen to about 0.52 from 0.76 in late June, and one-week…
The vast majority of the activity was concentrated in BlackRock’s IBIT product accounting for nearly…
Your day-ahead look for July 27, 2026Read MoreCoinDesk: Bitcoin, Ethereum, Crypto News and Price Data[#item_full_content]