Bitcoin price extended losses and declined below the $67,200 level. BTC found support near $66,650 and now consolidating in a range.
Bitcoin spiked below $67,000 but the bulls are still in action.
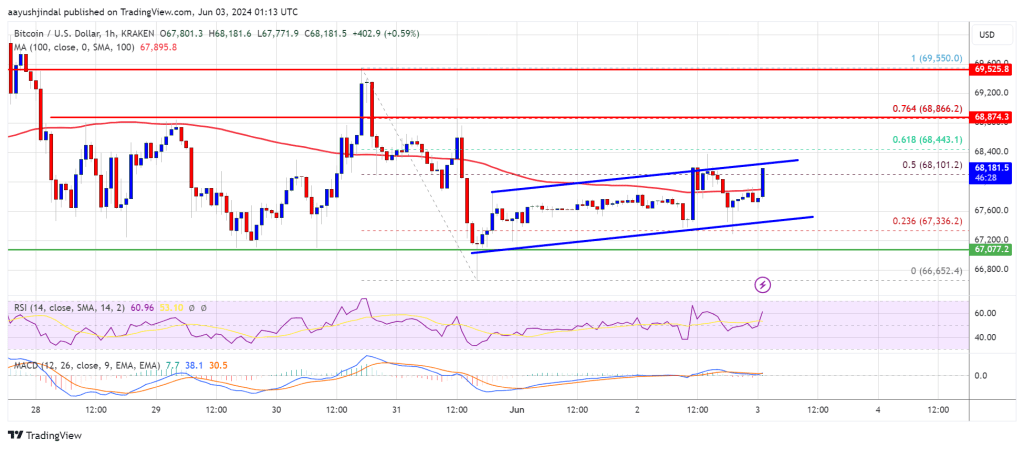
The price is trading above $68,000 and the 100 hourly Simple moving average.
There is a key rising channel forming with resistance at $68,200 on the hourly chart of the BTC/USD pair (data feed from Kraken).
The pair could gain bullish momentum if it settles above the $68,400 level.
Bitcoin price extended its decline below the $67,500 level. BTC tested the $66,650 zone and recently started a recovery wave. The price traded as low as $66,652 before it climbed back above $67,500.
The bulls were able to push the price back above $68,000. It even spiked above the 50% Fib retracement level of the downward move from the $69,550 swing high to the $66,652 low. Bitcoin price is now trading above $68,000 and the 100 hourly Simple moving average.
On the upside, the price is facing resistance near the $68,200 level. There is also a key rising channel forming with resistance at $68,200 on the hourly chart of the BTC/USD pair.
The first major resistance could be $68,400 or the 61.8% Fib retracement level of the downward move from the $69,550 swing high to the $66,652 low. The next key resistance could be $68,800. A clear move above the $68,800 resistance might send the price higher.
In the stated case, the price could rise and test the $69,500 resistance. Any more gains might send BTC toward the $70,600 resistance.
If Bitcoin fails to climb above the $68,400 resistance zone, it could start another decline. Immediate support on the downside is near the $67,500 level.
The first major support is $67,200. The next support is now forming near $67,000. Any more losses might send the price toward the $66,500 support zone in the near term.
Technical indicators:
Hourly MACD – The MACD is now gaining pace in the bullish zone.
Hourly RSI (Relative Strength Index) – The RSI for BTC/USD is now above the 50 level.
Major Support Levels – $67,500, followed by $67,000.
Major Resistance Levels – $68,400, and $68,800.
[#item_full_content]NewsBTCRead MoreOn-chain data shows the large Bitcoin holders have been participating in a notable amount of…
Google's quantum paper made headlines with that number. Here's what it means, what's actually at…
Ethereum could outpace Bitcoin by a wide margin over the next four years — at…
Bitcoin is often celebrated as a decentralized network, with mining power distributed globally to ensure…
Bitcoin (BTC) faces a stark downside risk that could send prices below the previous bear…
Crypto analyst Jordan has predicted that the Bitcoin price could rally to $80,000 in the…