Bitcoin price corrected gains and tested the $66,000 support. BTC is now consolidating losses and might decline further below the $65,500 zone.
Bitcoin is struggling to recover losses and moving lower below $67,200.
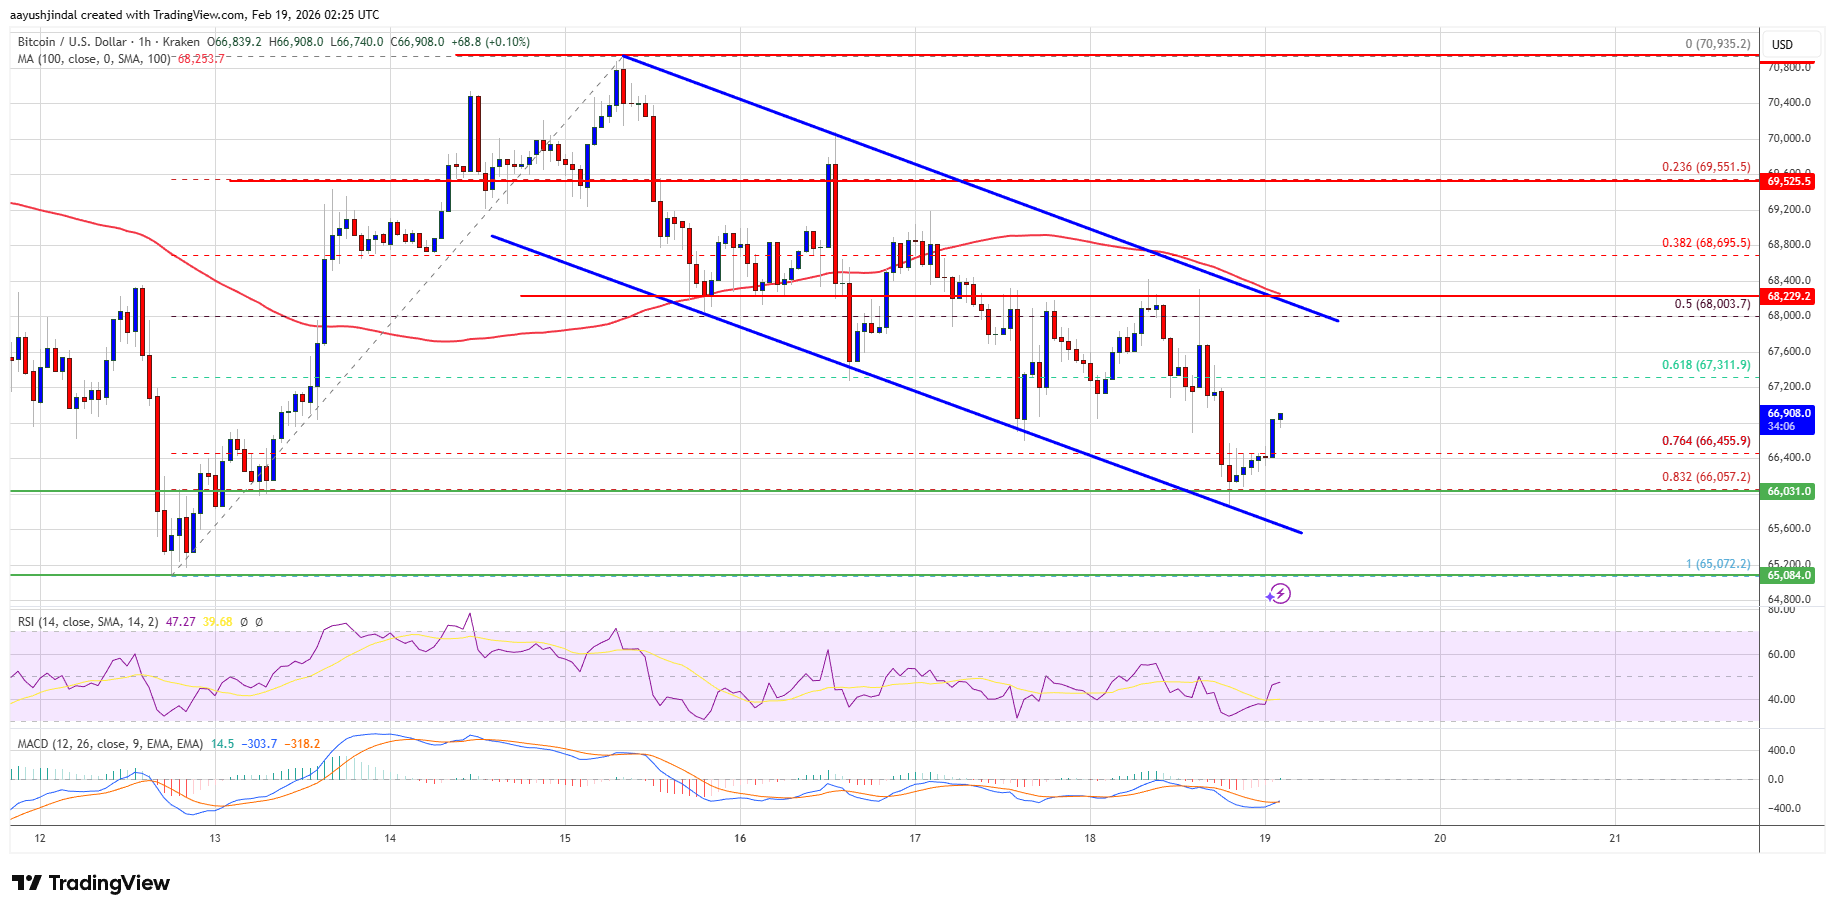
The price is trading below $67,200 and the 100 hourly simple moving average.
There is a declining channel forming with resistance at $68,000 on the hourly chart of the BTC/USD pair (data feed from Kraken).
The pair might dip again if it trades below the $66,000 and $65,500 levels.
Bitcoin price failed to remain stable above the $68,000 zone. BTC started a fresh decline and traded below the $67,500 support zone. There was a push below $67,000.
The price dipped below the 76.4% Fib retracement level of the upward move from the $65,072 swing low to the $70,935 high. Finally, the price found some support near the $66,000 zone. It is now consolidating losses and there is a declining channel forming with resistance at $68,000 on the hourly chart of the BTC/USD pair.
Bitcoin is now trading below $67,200 and the 100 hourly simple moving average. If the price remains stable above $66,000, it could attempt a fresh increase. Immediate resistance is near the $67,350 level.
The first key resistance is near the $68,000 level. A close above the $68,000 resistance might send the price further higher. In the stated case, the price could rise and test the $68,800 resistance. Any more gains might send the price toward the $69,500 level. The next barrier for the bulls could be $70,000 and $70,500.
If Bitcoin fails to rise above the $68,000 resistance zone, it could start another decline. Immediate support is near the $66,000 level or the 83.2% Fib retracement level of the upward move from the $65,072 swing low to the $70,935 high. The first major support is near the $65,500 level.
The next support is now near the $65,000 zone. Any more losses might send the price toward the $64,200 support in the near term. The main support now sits at $63,500, below which BTC might struggle to recover in the near term.
Technical indicators:
Hourly MACD – The MACD is now gaining pace in the bearish zone.
Hourly RSI (Relative Strength Index) – The RSI for BTC/USD is now below the 50 level.
Major Support Levels – $66,000, followed by $65,000.
Major Resistance Levels – $67,350 and $68,000.
[#item_full_content]NewsBTCRead MoreBitcoin (BTC) is showing early signs of a prolonged decline after peaking in October 2025.…
According to a recent on-chain data evaluation, the Bitcoin price might not be seeing a…
The Bitcoin market remains subject to high uncertainty, with bearish sentiments at heightened levels. In…
For the first time in nearly two months, the Bitcoin price had a sustained run…
On-chain data shows the Bitcoin sharks and whales have seen their population grow during the…
Bitcoin (BTC) has settled back into the familiar consolidation band between roughly $65,000 and $74,000…