Bitcoin price is moving lower from the $73,000 resistance. BTC must stay above the $67,000 support to start a fresh increase in the near term.
Bitcoin price is correcting gains and moving lower from the $73,000 zone.
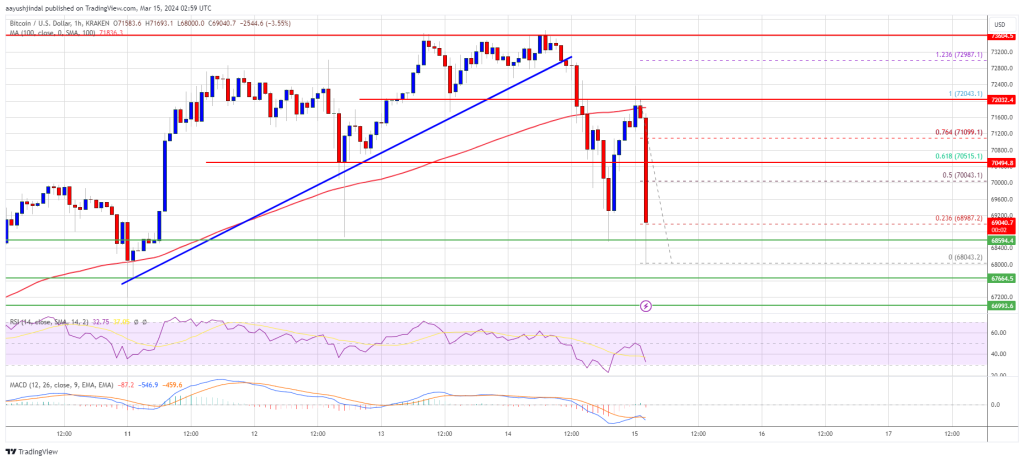
The price is trading below $71,000 and the 100 hourly Simple moving average.
There was a break below a key bullish trend line with support at $72,820 on the hourly chart of the BTC/USD pair (data feed from Kraken).
The pair could revisit the $67,000 support zone in the near term.
Bitcoin price made another attempt to gain strength above the $72,500 level. However, there was no clear move above the $72,500 level and the price reacted to the downside.
There was a drop below the $72,000 and $71,500 levels. Besides, there was a break below a key bullish trend line with support at $72,820 on the hourly chart of the BTC/USD pair. The pair even declined below the $70,000 level. A low is formed near $68,403 and the price is now showing a few bearish signs.
Bitcoin is now trading below $71,000 and the 100 hourly Simple moving average. Immediate resistance is near the $70,000 level or the 50% Fib retracement level of the downward move from the $72,043 swing high to the $68,403 low.
Source: BTCUSD on TradingView.com
The next key resistance could be $70,500 or the 61.8% Fib retracement level of the downward move from the $72,043 swing high to the $68,403 low, above which the price could rise toward the $72,000 resistance zone. If there is a clear move above the $72,000 resistance zone, the price could even attempt a move above the $73,000 resistance zone. Any more gains might send the price toward the $75,000 level.
If Bitcoin fails to rise above the $70,500 resistance zone, it could continue to move down. Immediate support on the downside is near the $68,500 level.
The first major support is $67,500. The main support sits at $67,000. If there is a close below $67,000, the price could start a decent pullback toward the $65,500 level. Any more losses might send the price toward the $65,000 support zone.
Technical indicators:
Hourly MACD – The MACD is now gaining pace in the bearish zone.
Hourly RSI (Relative Strength Index) – The RSI for BTC/USD is now below the 50 level.
Major Support Levels – $68,500, followed by $67,000.
Major Resistance Levels – $70,500, $72,000, and $73,000.
[#item_full_content]NewsBTCRead MoreA modest claim. A bold number. Both are on the table for Bitcoin this week…
Over the past two weeks, the Bitcoin market saw an overwhelming sellers’ dominance, with no…
Market analyst Michaël van de Poppe has noted an important on-chain development that implies a…
The project's creator nearly deleted the viral AI agent after crypto scammers hijacked his accounts,…
At the beginning of February, the price of Bitcoin tumbled to a new low not…
As it stands, the premier cryptocurrency maintains its broader bearish structure, with its price struggling…