Bitcoin price failed to continue higher above $94,000. BTC is now gaining bearish pace and might decline further below $89,500.
Bitcoin started a downside correction from the $94,500 zone.
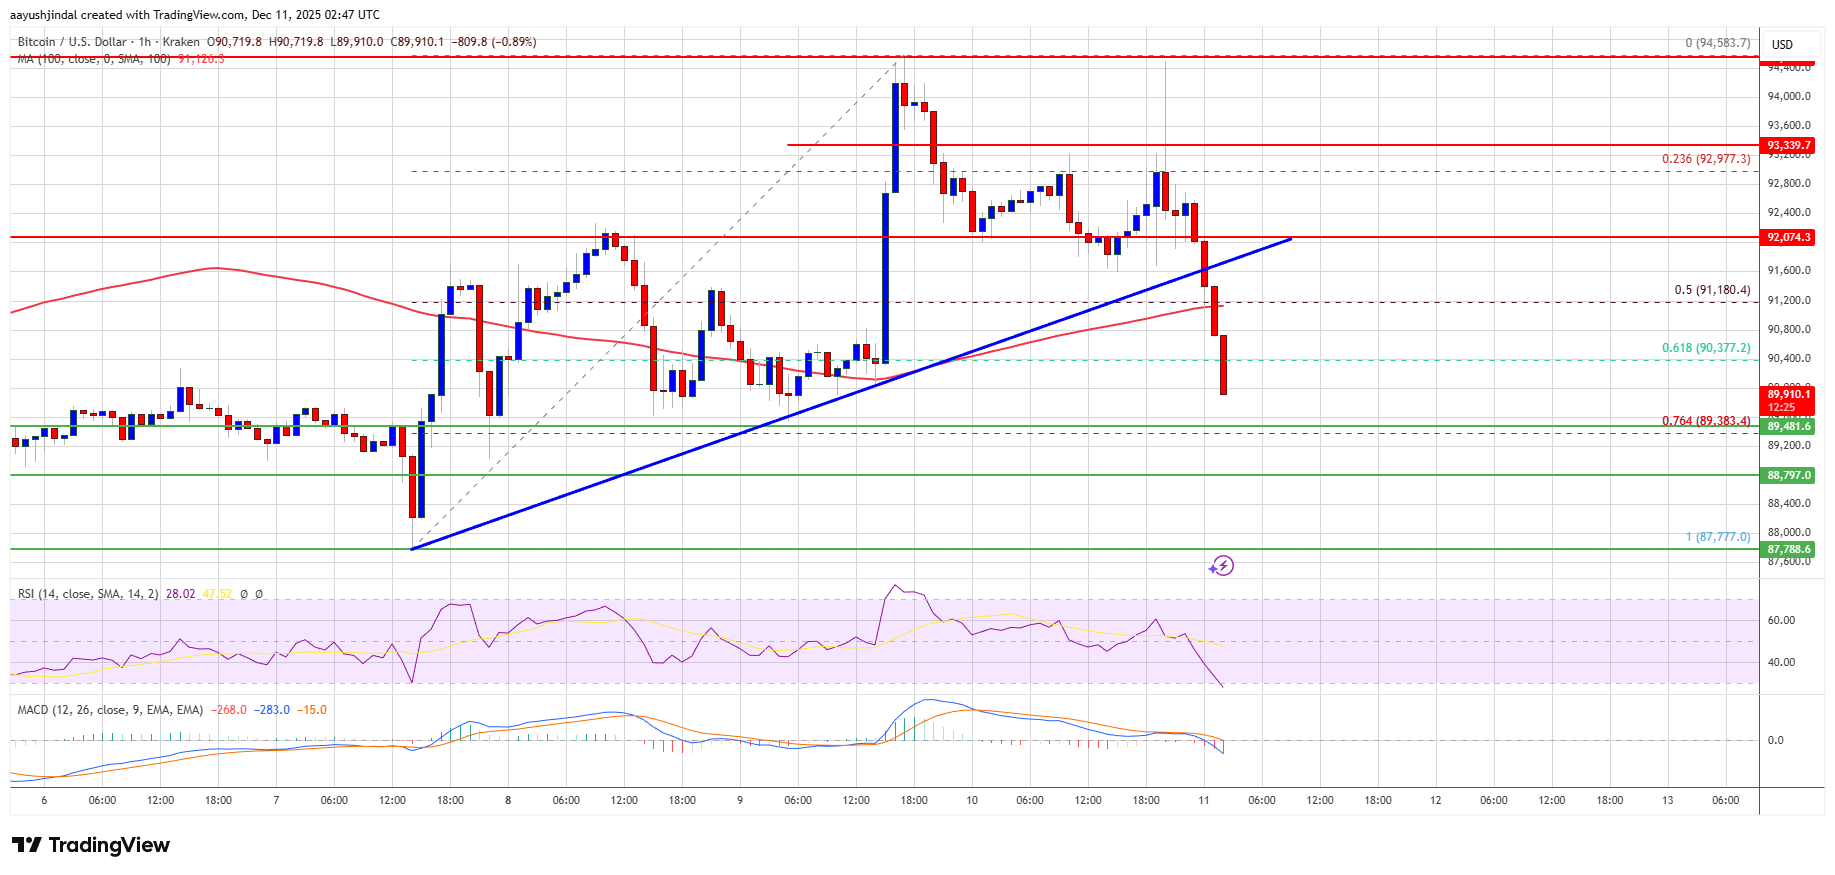
The price is trading below $92,000 and the 100 hourly Simple moving average.
There was a break below a bullish trend line with support at $91,600 on the hourly chart of the BTC/USD pair (data feed from Kraken).
The pair might continue to move down if it settles below the $89,500 zone.
Bitcoin price failed to gain strength for a move above the $94,000 and $94,500 levels. BTC started a downside correction and traded below the $92,000 support.
There was a clear move below the 50% Fib retracement level of the upward move from the $87,777 swing low to the $94,583 high. Besides, there was a break below a bullish trend line with support at $91,600 on the hourly chart of the BTC/USD pair.
Bitcoin is now trading below $91,200 and the 100 hourly Simple moving average. The price is now approaching the $89,500 support, and the 76.4% Fib retracement level of the upward move from the $87,777 swing low to the $94,583 high.
If the bulls remain in action, the price could attempt another increase. Immediate resistance is near the $91,200 level. The first key resistance is near the $91,500 level. The next resistance could be $92,000. A close above the $92,000 resistance might send the price further higher. In the stated case, the price could rise and test the $92,850 resistance. Any more gains might send the price toward the $93,500 level. The next barrier for the bulls could be $94,000 and $94,500.
If Bitcoin fails to rise above the $92,000 resistance zone, it could start another decline. Immediate support is near the $89,500 level. The first major support is near the $88,800 level.
The next support is now near the $87,750 zone. Any more losses might send the price toward the $86,500 support in the near term. The main support sits at $85,000, below which BTC might accelerate lower in the near term.
Technical indicators:
Hourly MACD – The MACD is now gaining pace in the bearish zone.
Hourly RSI (Relative Strength Index) – The RSI for BTC/USD is now below the 50 level.
Major Support Levels – $89,500, followed by $88,800.
Major Resistance Levels – $91,200 and $92,000.
[#item_full_content]NewsBTCRead MoreBitcoin Magazine Coinbase CPO Rejects Claims of Opposing Bitcoin Tax Relief as Jack Dorsey Demands…
The security architecture surrounding Bitcoin continues to evolve as new infrastructure emerges to support self-custody…
Bitcoin is up about 7% from the Sunday lows, even as equities and gold tread…
Bitcoin Magazine Cosmos Health (COSM) Buys $600K in Bitcoin, Expands Digital Asset Treasury Cosmos Health…
Bitcoin Magazine Bitcoin is Now a Global Financial Player as Institutions Take the Helm: Bitwise…
Bitcoin Magazine Michael Saylor’s Strategy (MSTR) Estimated To Have Already Bought Over 1,200 Bitcoin Today…