Bitcoin price is moving lower below the $27,200 support. BTC could decline further if the Israel-Hamas war escalates in the near term.
Bitcoin is moving lower and showing bearish signs below $27,500.
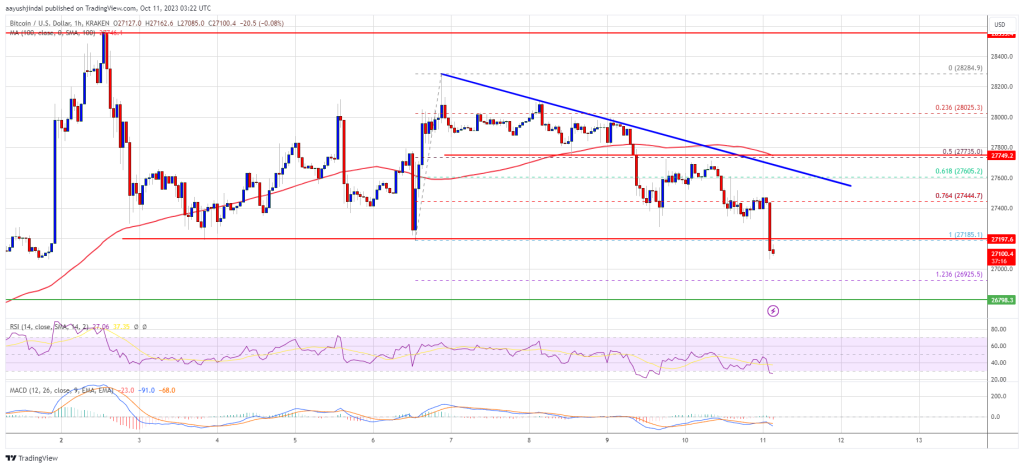
The price is trading below $27,500 and the 100 hourly Simple moving average.
There is a key bearish trend line forming with resistance near $27,550 on the hourly chart of the BTC/USD pair (data feed from Kraken).
The pair could accelerate lower below the $27,000 support in the near term.
Bitcoin price failed to gain pace above the $27,800 resistance. BTC reacted to the downside amid rising Israel-Hamas tensions. There were more than 1200 deaths reported already by Israel.
The price is moving lower below the $27,500 pivot level. There was also a downside break below the 76.4% Fib retracement level of the upward move from the $27,185 swing low to the $28,284 high. More importantly, the price traded below the key $27,200 support zone.
Bitcoin is now trading below $27,500 and the 100 hourly Simple moving average. There is also a key bearish trend line forming with resistance near $27,550 on the hourly chart of the BTC/USD pair.
If there is an upside correction, the price might face resistance near the $27,400 level. The next key resistance could be near the $27,500 level and the trend line. The first major resistance is $27,800, above which Bitcoin might test $28,250.
Source: BTCUSD on TradingView.com
The main downtrend resistance could be $28,500. A close above the $28,500 resistance could start another increase. In the stated case, the price could rise toward the $30,000 resistance.
If Bitcoin fails to recover higher above the $27,500 resistance, there could be more losses. Immediate support on the downside is near the $27,000 level or the 1.236 Fib extension level of the upward move from the $27,185 swing low to the $28,284 high.
The next major support is near the $26,500 level. A downside break and close below the $26,500 support might send the price further lower. The next support sits at $26,000.
Technical indicators:
Hourly MACD – The MACD is now gaining pace in the bearish zone.
Hourly RSI (Relative Strength Index) – The RSI for BTC/USD is now below the 50 level.
Major Support Levels – $27,000, followed by $26,500.
Major Resistance Levels – $27,400, $27,500, and $28,500.
[#item_full_content]NewsBTCRead MoreBitcoin is holding above $70,000. The number looks resilient. The geography behind it tells a…
Crypto analyst Crypto Patel has outlined a roadmap for how Bitcoin could rally to $300,000.…
Strategy, the Michael Saylor-led company that has made Bitcoin accumulation its core business, bought $76.6…
Bitcoin Magazine Bitcoin Volatility Falls as Asset Matures, Charles Schwab Report Finds A new report…
A crypto analyst who correctly predicted Bitcoin’s (BTC) cycle peak around $125,000 has released a…
Bitcoin Magazine Bitwise Joins Lombard’s Bitcoin Smart Accounts to Help Unlock Institutional Yield Bitwise Asset…