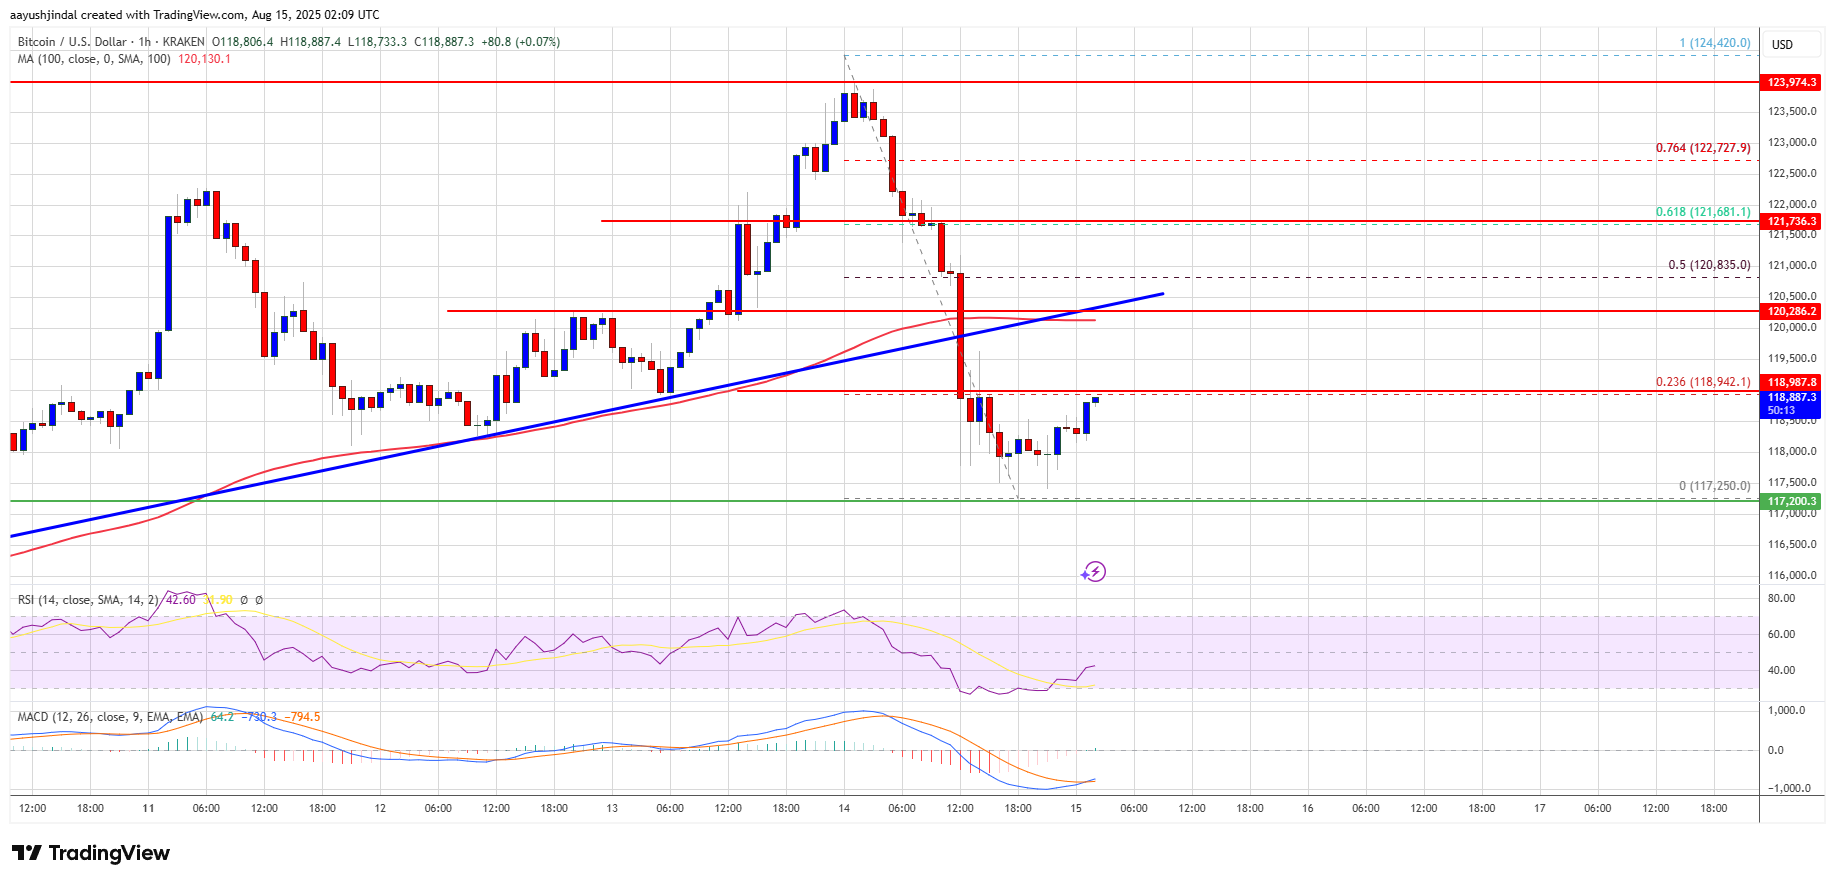
Bitcoin price is trimming gains from the $124,000 zone. BTC is now consolidating below $120,000 and might aim for a recovery wave.
Bitcoin started a downside correction from the $124,000 zone.
The price is trading below $122,000 and the 100 hourly Simple moving average.
There was a break below a key bullish trend line with support at $120,000 on the hourly chart of the BTC/USD pair (data feed from Kraken).
The pair might start another increase if it clears the $120,000 resistance zone.
Bitcoin price traded to a new all-time high near $124,000 before the bears appeared. BTC started a correction and traded below the $122,000 support zone.
There was a move below the $121,200 support zone and the 100 hourly Simple moving average. Besides, there was a break below a key bullish trend line with support at $120,000 on the hourly chart of the BTC/USD pair. The pair tested the $117,250 zone.
It is now consolidating losses and has recovered some losses to test the 23.6% Fib retracement level of the move from the $124,420 swing high to the $117,250 low. Bitcoin is now trading below $120,000 and the 100 hourly Simple moving average.
Immediate resistance on the upside is near the $119,000 level. The first key resistance is near the $120,000 level. The next resistance could be $120,500. A close above the $120,500 resistance might send the price further higher.
In the stated case, the price could rise and test the $121,650 resistance level or the 61.8% Fib retracement level of the move from the $124,420 swing high to the $117,250 low. Any more gains might send the price toward the $122,200 level. The main target could be $123,500.
If Bitcoin fails to rise above the $120,000 resistance zone, it could start a fresh decline. Immediate support is near the $118,000 level. The first major support is near the $117,250 level.
The next support is now near the $116,500 zone. Any more losses might send the price toward the $115,500 support in the near term. The main support sits at $113,500, below which BTC might continue to move down.
Technical indicators:
Hourly MACD – The MACD is now losing pace in the bullish zone.
Hourly RSI (Relative Strength Index) – The RSI for BTC/USD is now below the 50 level.
Major Support Levels – $117,250, followed by $116,500.
Major Resistance Levels – $120,000 and $120,500.
[#item_full_content]NewsBTCRead MoreBitcoin Magazine Bitcoin’s Moment Has Come for the Far East, Says Metaplanet CEO Bitcoin’s time…
Bitcoin Magazine Debasement Trade Is Here Thanks to Government Debt — And Bitcoin Will Benefit:…
Bitcoin Magazine Capital B Raises €21M From Adam Back and TOBAM To Buy More BTC…
Bitcoin Magazine Bitcoin Drops Before Shrugging Off Fed Chair’s Inflation Comments Bitcoin dropped, then popped…
Your day-ahead look for Aug. 28, 2026Read MoreCoinDesk: Bitcoin, Ethereum, Crypto News and Price Data[#item_full_content]
BTC briefly touched $81,455 overnight, its highest since May 15 as Nasdaq futures slipped and…