Bitcoin price started a sharp decline from well above $72,000. BTC is now consolidating and might extend losses unless there is a close above $70,000.
Bitcoin started a sharp decline below $71,200 and $70,500.
The price is trading below $70,500 and the 100 hourly simple moving average.
There is a bearish trend line forming with resistance at $69,200 on the hourly chart of the BTC/USD pair (data feed from Kraken).
The pair might continue to decline if it stays below the $69,200 and $70,000 levels.
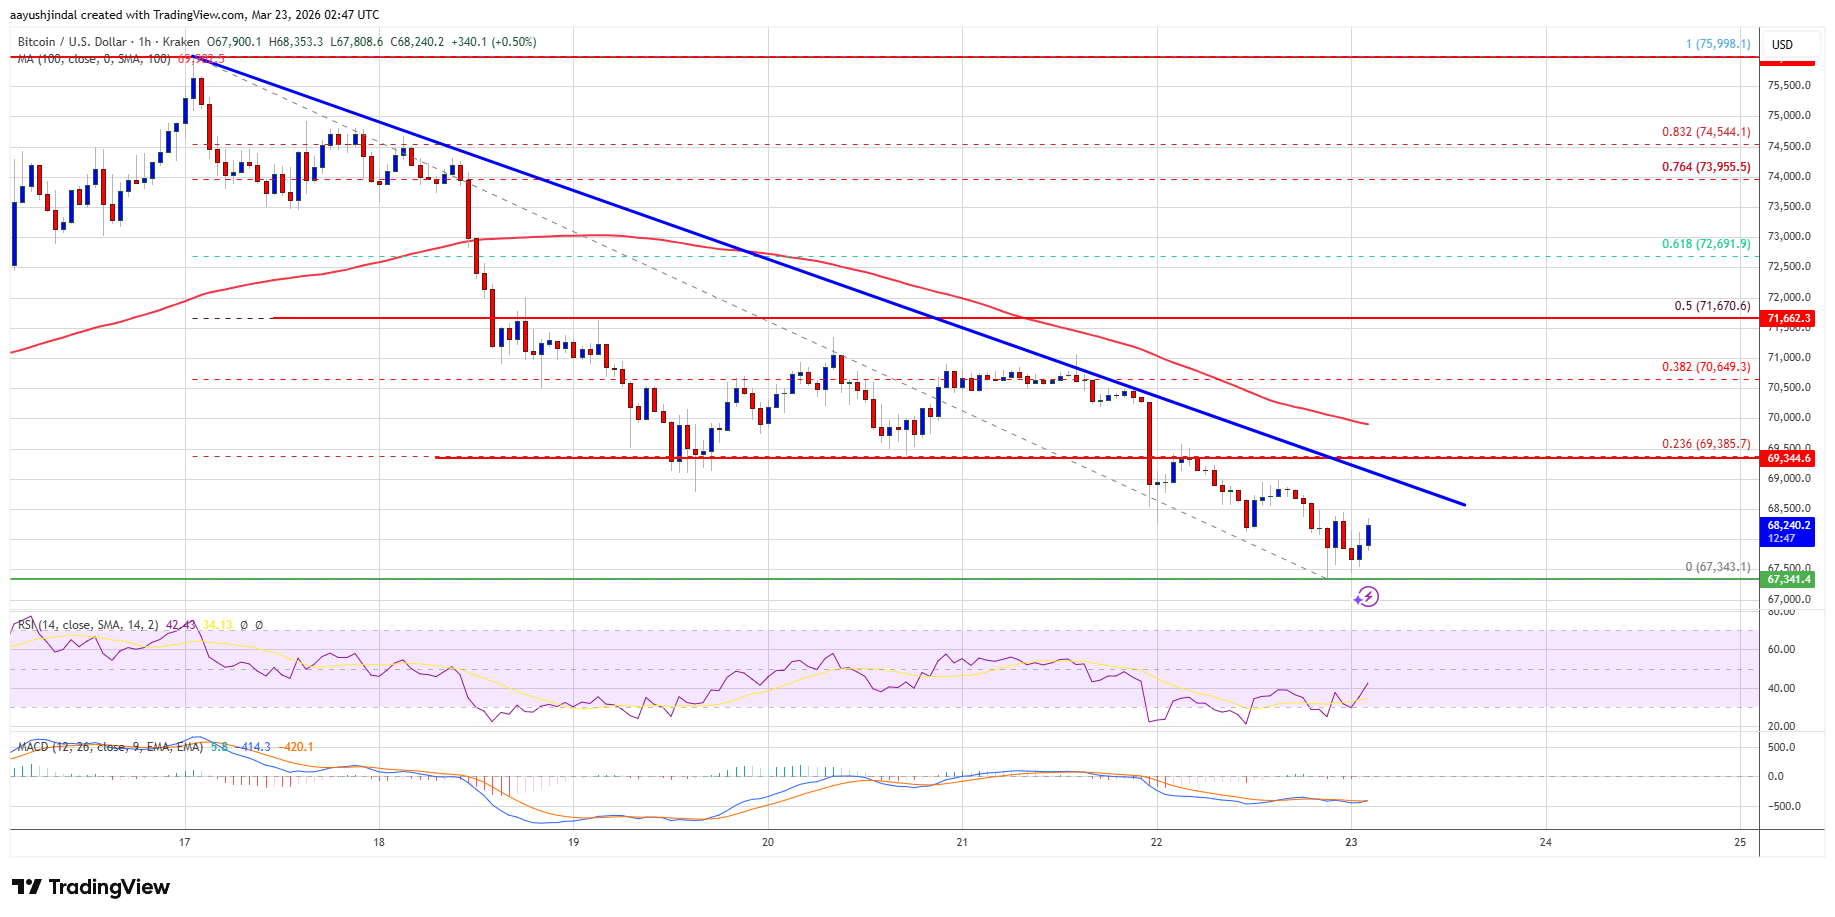
Bitcoin price started a sharp decline from well above $72,000. BTC declined below $71,200 and $70,000 to enter a short-term bearish zone.
The bears even pushed the price below $69,500. There was a move toward $67,500. A low was formed at $67,343, and the pair is now consolidating losses. There was a minor upward move above $68,000, but the price stayed well below the 23.6% Fib retracement level of the downward move from the $75,999 swing high to the $67,343 low.
Bitcoin is now trading below $70,000 and the 100 hourly simple moving average. Besides, there is a bearish trend line forming with resistance at $69,200 on the hourly chart of the BTC/USD pair.
If the price remains stable above $68,000, it could attempt a fresh increase. Immediate resistance is near the $69,000 level. The first key resistance is near the $69,200 level and the trend line. A close above the $69,200 resistance might send the price further higher.
In the stated case, the price could rise and test the $70,000 resistance. Any more gains might send the price toward the $71,650 level or the 50% Fib retracement level of the downward move from the $75,999 swing high to the $67,343 low. The next barrier for the bulls could be $72,800.
If Bitcoin fails to rise above the $70,000 resistance zone, it could start another decline. Immediate support is near the $68,000 level. The first major support is near the $67,250 level.
The next support is now near the $66,500 zone. Any more losses might send the price toward the $65,000 support in the near term. The main support now sits at $63,500, below which BTC might struggle to recover in the near term.
Technical indicators:
Hourly MACD – The MACD is now gaining pace in the bearish zone.
Hourly RSI (Relative Strength Index) – The RSI for BTC/USD is now below the 50 level.
Major Support Levels – $68,000, followed by $67,250.
Major Resistance Levels – $69,200 and $70,000.
[#item_full_content]NewsBTCRead MoreBitcoin held above $62,500 and ether near $1,665, but sluggish price action and widening put…
A surge in Rune protocol activity is pushing Bitcoin transaction counts and fee generation to…
CryptoQuant says the cash cushion behind Strategy's STRC has thinned from seven years of coverage…
Bitcoin "OGs" have slashed their selling activity to the lowest levels in nearly two years.Read…
Trading firm Wintermute's options desk puts bitcoin in a $61,242 to $63,563 range for Tuesday,…
A renewed rout in semiconductor stocks pulled risk assets lower again, and crypto kept sliding.…