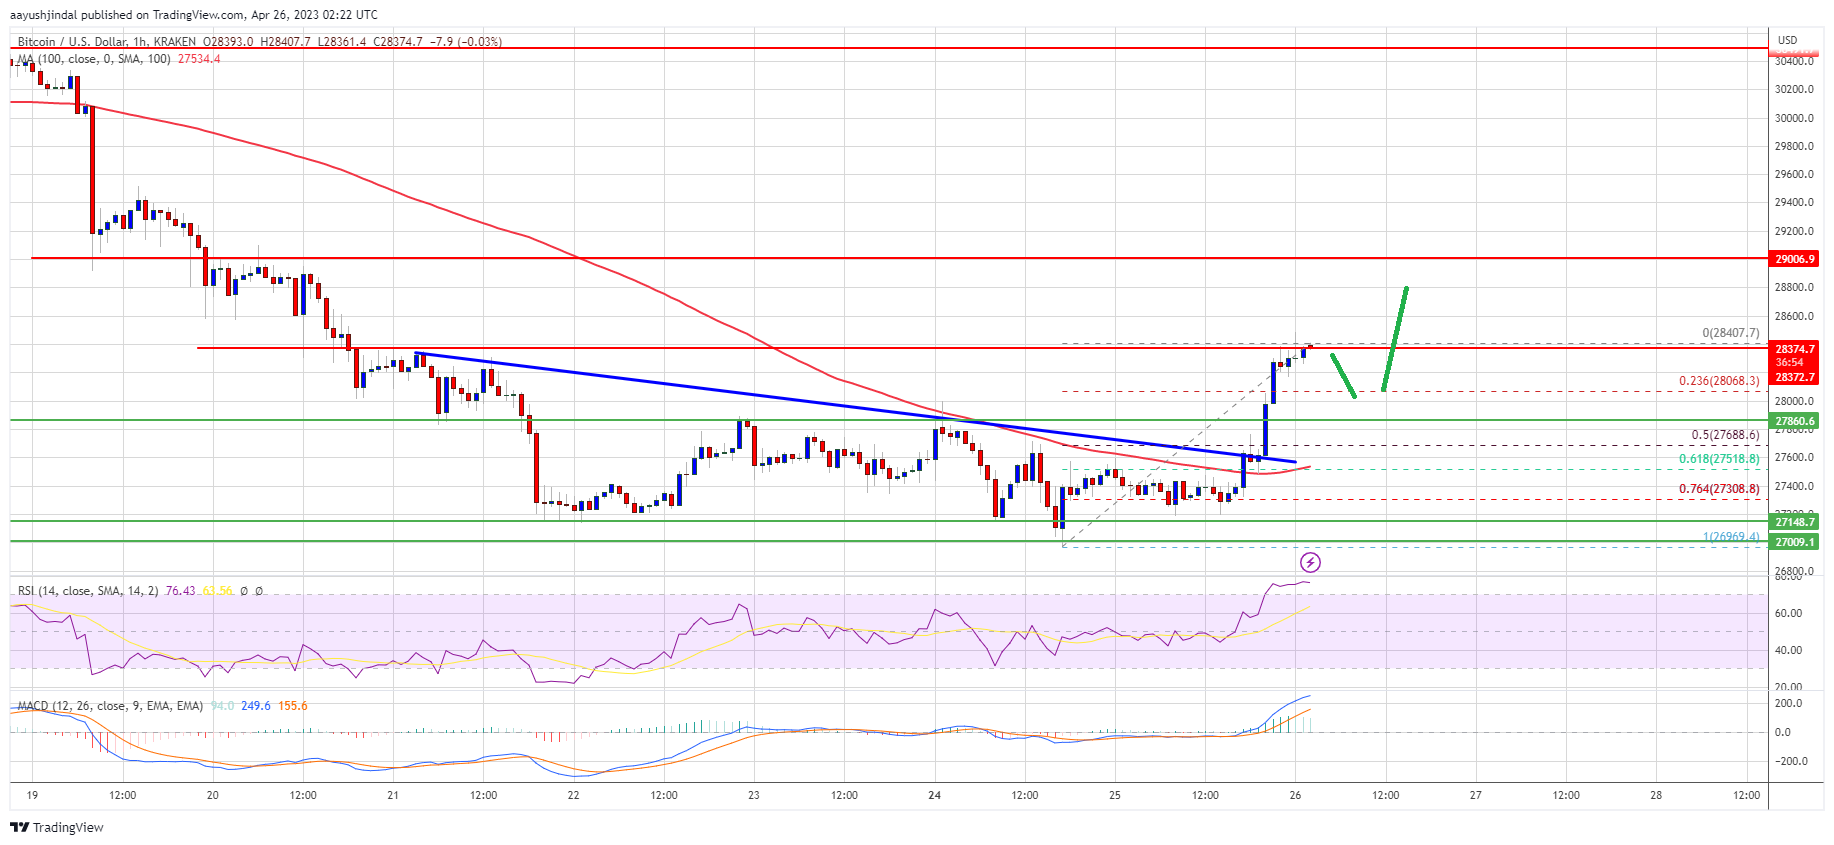
Bitcoin price is correcting higher from the $27,000 support. BTC must clear $29,000 to continue higher in the near term.
Bitcoin formed a base and corrected higher above the $27,500 resistance.
The price is trading above $27,800 and the 100 hourly Simple moving average.
There was a break above a connecting bearish trend line with resistance near $27,600 on the hourly chart of the BTC/USD pair (data feed from Kraken).
The pair could continue to rise if it clears the $28,400 and $29,000 resistance levels.
Bitcoin price extended its decline below the $27,500 level. However, BTC remained well-bid above the $27,000 zone. A low was formed near $26,969 before the price started an upside correction.
The price was able to climb above the $27,500 resistance. Besides, there was a break above a connecting bearish trend line with resistance near $27,600 on the hourly chart of the BTC/USD pair. It is now trading above $27,800 and the 100 hourly Simple moving average.
Bitcoin price is now facing resistance near the $28,400 level. A high is formed near $28,407 and the price is now consolidating gains. It is trading well above the 23.6% Fib retracement level of the recent increase from the $26,969 low to the $28,407 high.
Source: BTCUSD on TradingView.com
Immediate resistance is near the $28,400 level. The next major resistance sits near the $29,000 zone. A close above the $29,000 resistance could start a decent increase. In the stated case, the price may perhaps rise toward the $29,800 resistance zone. Any more gains could open the doors for a test of $30,000.
If Bitcoin’s price fails to clear the $28,400 resistance, it could react to the downside. Immediate support on the downside is near the $28,000 level.
The next major support is near the $27,800 zone or the 50% Fib retracement level of the recent increase from the $26,969 low to the $28,407 high. A downside break and close below the $27,680 support might push the price toward the $27,500 support. Any more losses might take Bitcoin toward $27,000.
Technical indicators:
Hourly MACD – The MACD is now gaining pace in the bullish zone.
Hourly RSI (Relative Strength Index) – The RSI for BTC/USD is now above the 50 level.
Major Support Levels – $28,000, followed by $27,680.
Major Resistance Levels – $28,400, $29,000, and $30,000.
[#item_full_content]NewsBTCRead MoreBitcoin remains locked in a tight range, leaving traders uncertain about its next major move.…
Bitcoin’s miner supply picture remains tighter than in past cycles, but not tight enough to…
A crypto analyst has issued a bold long-term forecast for Bitcoin, predicting that a capital…
Bitcoin is holding above $70,000. The number looks resilient. The geography behind it tells a…
Crypto analyst Crypto Patel has outlined a roadmap for how Bitcoin could rally to $300,000.…
Strategy, the Michael Saylor-led company that has made Bitcoin accumulation its core business, bought $76.6…